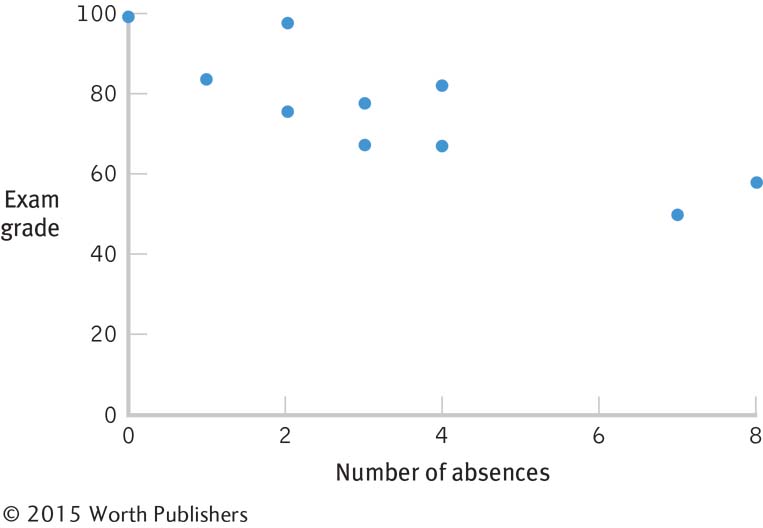
image
FIGURE 13-6 Always Start with a Scatterplot Let your eyes do the work! Look at the scatterplot before calculating a correlation coefficient. Do the dots appear to form a straight line? Do they flow up and to the right (positive) or down and to the right (negative)? The dots in this scatterplot cluster tightly around an imaginary straight line that goes down and to the right so the correlation will probably be fairly close to −1.00.