FIGURE
G-
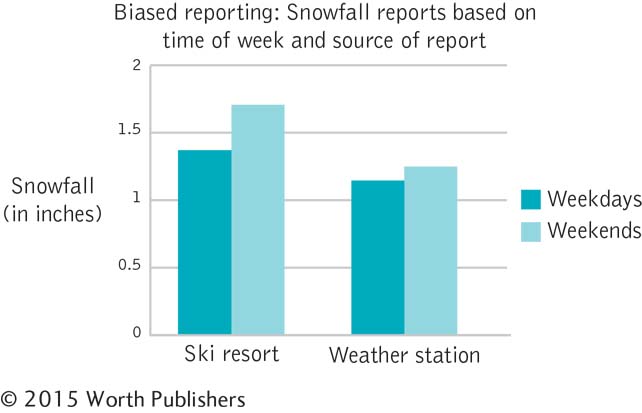
3 A Graph Created in Excel That Has Been Altered to Adhere to the Graphing Guidelines
Notice that the bars are tw
o-
dimensional and that the label for the
y
-axis is turned horizontally so that it is easy to read.