FIGURE 3-
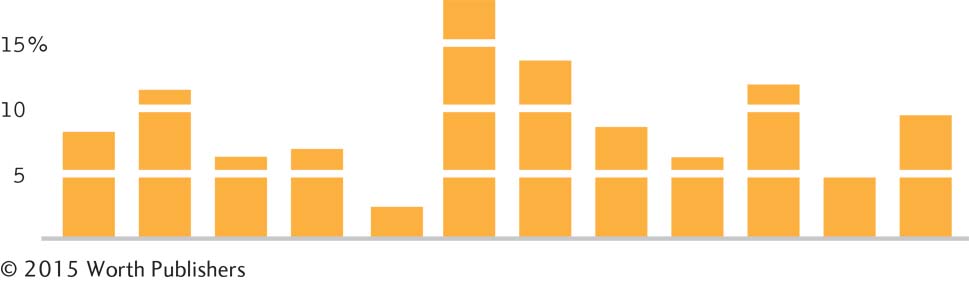
Redesigning the Bar Graph
Tufte (2001/2006b) suggests eliminating the frame and the y-axis, as well as adding thin white lines through the bars. These changes make this bar graph easier to read and increases the data–
Redesigning the Bar Graph
Tufte (2001/2006b) suggests eliminating the frame and the y-axis, as well as adding thin white lines through the bars. These changes make this bar graph easier to read and increases the dat