FIGURE 6-
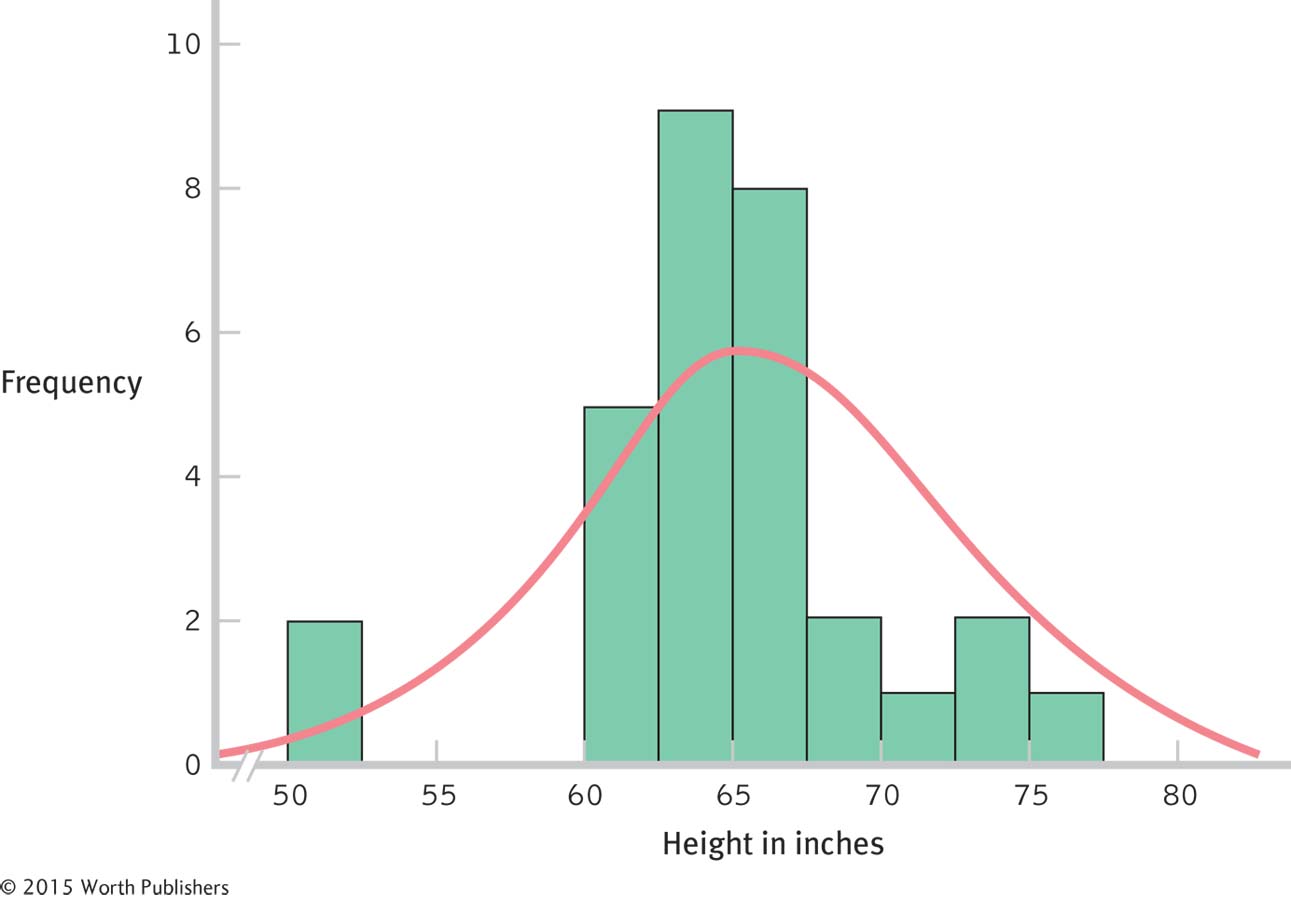
Sample of 30
Here is a histogram of the heights in inches of 30 students. With a larger sample, the data begin to resemble the normal curve of an entire population of heights.
Sample of 30
Here is a histogram of the heights in inches of 30 students. With a larger sample, the data begin to resemble the normal curve of an entire population of heights.