FIGURE 6-
Creating a Distribution of Means
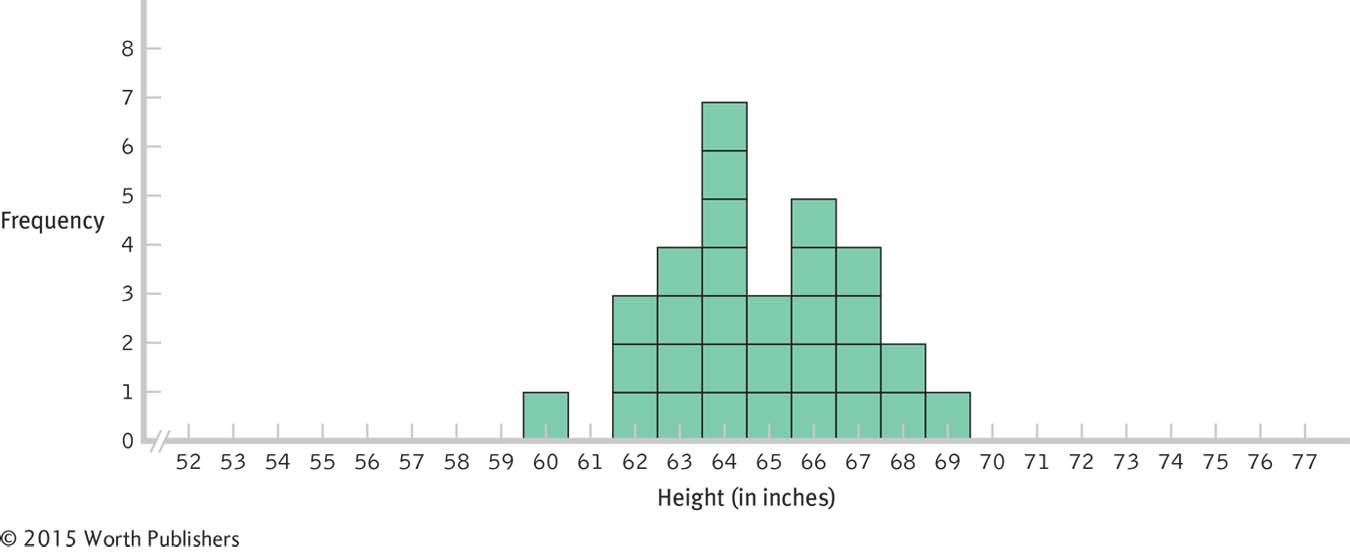
Compare this distribution of means to the distribution of scores in Figure 6-10. The mean is the same and it is still roughly bell-
Creating a Distribution of Means
Compare this distribution of means to the distribution of scores in Figure 6-10. The mean is the same and it is still roughly bel