FIGURE 7-
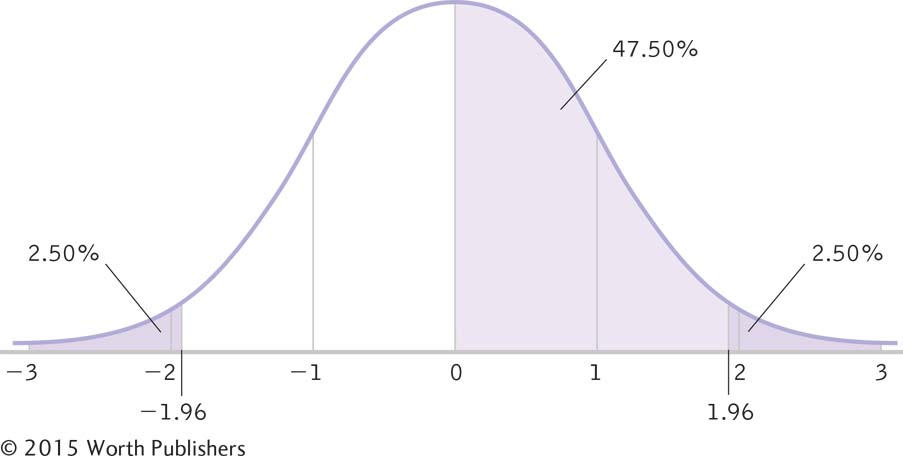
Determining Critical Values for a z Distribution
We typically determine critical values in terms of z statistics so we can easily compare a test statistic to determine whether it is beyond the critical values. Here z scores of –1.96 and 1.96 indicate the most extreme 5% of the distribution, 2.5% in each tail.