10.4 SPSS®
We can conduct an independent-samples t test using SPSS for the wine-tasting data we presented earlier in this chapter. We start by creating two columns of data, one for stated cost of the bottle ($10 versus $90) and one for the liking rating. For wine cost, we could, for example, give a “1” to each person told that the wine is from a $10 bottle, and give a “2” to each person told that the wine is from a $90 bottle. We can use the “Values” function in the Variable View to tell SPSS that 1 = $10 and 2 = $90. We place each participant’s data in one row—a score for the stated cost of the wine in the first column and a liking rating in the second column. We can now conduct the hypothesis test.
Select Analyze → Compare Means → Independent-Samples T Test. Choose the dependent variable, “rating,” by clicking it, then clicking the arrow in the upper center. Choose the independent variable, “cost,” by clicking it, then clicking the arrow in the lower center. Click the “Define Groups” button, then provide the values for each level of the independent variable. For example, enter “1” for group 1 and “2” for group 2, and click “Continue.” Then click “OK.”
Part of the output is shown in the screenshot below. Toward the top, we see means and standard deviations for participants told they were drinking wine from a $10 bottle and participants told they were drinking wine from a $90 bottle. For example, the output tells us that the mean for those told they were drinking wine from a $10 bottle is 2.5, with a standard deviation of 0.80416. Below, we can see that the t statistic is −2.436, with a p value (under “Sig. (2-tailed)”) of 0.045. Look in the top line in the “Independent Samples Test” section. The t statistic is the same as the one we calculated earlier, −2.44.
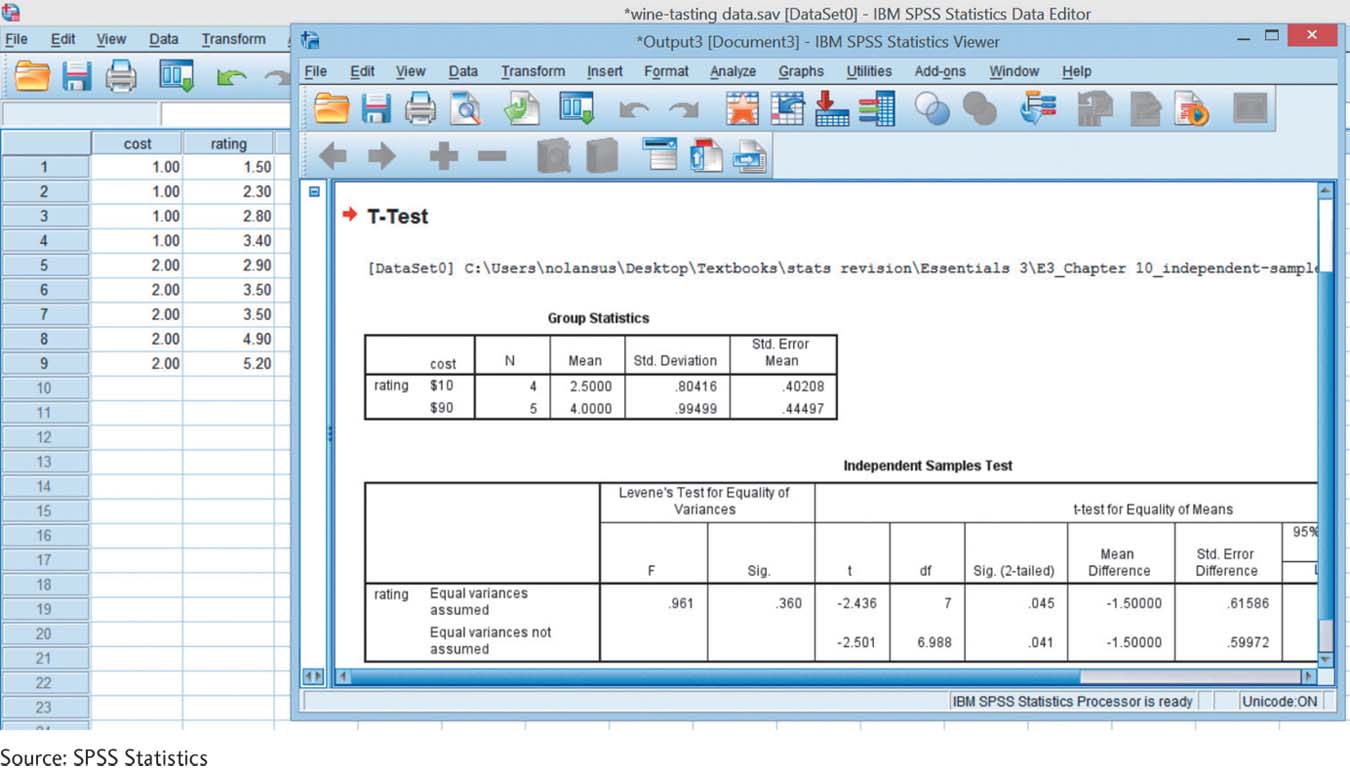
Source: SPSS Statistics