Exercises
Clarifying the Concepts
314
Question 11.1
| 11.1 |
What is an ANOVA? |
Question 11.2
| 11.2 |
What do the F distributions allow us to do that the t distributions do not? |
Question 11.3
| 11.3 |
The F statistic is a ratio of between- |
Question 11.4
| 11.4 |
What is the difference between a within- |
Question 11.5
| 11.5 |
What are the three assumptions for a between- |
Question 11.6
| 11.6 |
The null hypothesis for ANOVA posits no difference among population means, as in other hypothesis tests, but the research hypothesis in this case is a bit different. Why? |
Question 11.7
| 11.7 |
Why is the F statistic always positive? |
Question 11.8
| 11.8 |
In your own words, define the word source as you would use it in everyday conversation. Provide at least two different meanings that might be used. Then define the word as a statistician would use it. |
Question 11.9
| 11.9 |
Explain the concept of sum of squares. |
Question 11.10
| 11.10 |
The total sum of squares for a one- |
Question 11.11
| 11.11 |
What is the grand mean? |
Question 11.12
| 11.12 |
How do we calculate the between- |
Question 11.13
| 11.13 |
What do we typically use to measure effect size for a z test or a t test? What do we use to measure effect size for an ANOVA? |
Question 11.14
| 11.14 |
What are Cohen’s conventions for interpreting effect size using R2? |
Question 11.15
| 11.15 |
What does post hoc mean, and when are these tests needed with ANOVA? |
Question 11.16
| 11.16 |
Define the symbols in the following formula: |
Question 11.17
| 11.17 |
Find the error in the statistics language in each of the following statements about z, t, or F distributions or their related tests. Explain why it is incorrect and provide the correct word.
|
Question 11.18
| 11.18 |
Find the incorrectly used symbol or symbols in each of the following statements or formulas. For each statement or formula, (i) state which symbol(s) is/are used incorrectly, (ii) explain why the symbol(s) in the original statement is/are incorrect, and (iii) state which symbol(s) should be used.
|

Question 11.19
| 11.19 |
What are the four assumptions for a within- |
Question 11.20
| 11.20 |
What are order effects? |
Question 11.21
| 11.21 |
Explain the source of variability called “subjects.” |
Question 11.22
| 11.22 |
What is the advantage of the design of the within- |
Question 11.23
| 11.23 |
What is counterbalancing? |
Question 11.24
| 11.24 |
Why is it appropriate to counterbalance when using a within- |
Question 11.25
| 11.25 |
How do we calculate the sum of squares for subjects? |
Question 11.26
| 11.26 |
How is the calculation of dfwithin different in a between- |
Question 11.27
| 11.27 |
How could we turn a between- |
Question 11.28
| 11.28 |
What are some situations in which it might be impossible— |
Question 11.29
| 11.29 |
How is the calculation of effect size different for a one- |
Calculating the Statistics
Question 11.30
| 11.30 |
For the following data, assuming a between- Group 1: 11, 17, 22, 15 Group 2: 21, 15, 16 Group 3: 7, 8, 3, 10, 6, 4 Group 4: 13, 6, 17, 27, 20 315
|
Question 11.31
| 11.31 |
For the following data, assuming a between- 1990: 45, 211, 158, 74 2000: 92, 128, 382 2010: 273, 396, 178, 248, 374
|
Question 11.32
| 11.32 |
Calculate the F statistic, writing the ratio accurately, for each of the following cases:
|
Question 11.33
| 11.33 |
Calculate the F statistic, writing the ratio accurately, for each of the following cases:
|
Question 11.34
| 11.34 |
An incomplete one-
|
Question 11.35
| 11.35 |
An incomplete one-
|
Question 11.36
| 11.36 |
Each of the following is a calculated F statistic with its degrees of freedom. Using the F table, estimate the level of significance for each. You can do this by indicating whether its likelihood of occurring is greater than or less than a p level shown on the table.
|
Question 11.37
| 11.37 |
A researcher designs an experiment in which the single independent variable has four levels. If the researcher performed an ANOVA and rejected the null hypothesis, how many post hoc comparisons would she make (assuming she was making all possible comparisons)? |
Question 11.38
| 11.38 |
A researcher designs an experiment in which the single independent variable has five levels. If the researcher performed an ANOVA and rejected the null hypothesis, how many post hoc comparisons would he make (assuming he was making all possible comparisons)? |
Question 11.39
| 11.39 |
For the following data, assuming a within-
|
|||||||||||||||||||||||||
Question 11.40
| 11.40 |
For the following data, assuming a within-
|
|||||||||||||||||||||||||||||||||||
Question 11.41
| 11.41 |
For the following incomplete source table below for a one-
|
Question 11.42
| 11.42 |
Assume that a researcher had 14 individuals participate in all three conditions of her experiment. Use this information to complete the source table below.
|
Applying the Concepts
Question 11.43
| 11.43 |
Comedy versus news and hypothesis testing: Focusing on coverage of the U.S. presidential election, Julia R. Fox, a telecommunications professor at Indiana University, wondered whether The Daily Show, despite its comedy format, was a valid source of news. She coded a number of half-
|
Question 11.44
| 11.44 |
The comparison distribution: For each of the following situations, state whether the distribution of interest is a z distribution, a t distribution, or an F distribution. Explain your answer.
|
Question 11.45
| 11.45 |
The comparison distribution: For each of the following situations, state whether the distribution of interest is a z distribution, a t distribution, or an F distribution. Explain your answer.
|
Question 11.46
| 11.46 |
Links among distributions: The z, t, and F distributions are closely linked. In fact, it is possible to use an F distribution in all cases in which a t or a z could be used.
|
Question 11.47
| 11.47 |
International students and type of ANOVA: Catherine Ruby, a doctoral student at New York University, conducted an online survey to ascertain the reasons that international students chose to attend graduate school in the United States. One of several dependent variables that she considered was reputation; students were asked to rate the importance in their decision of factors such as the reputation of the institution, the institution and program’s academic accreditations, and the reputation of the faculty. Students rated factors on a 1–
|
Question 11.48
| 11.48 |
Type of ANOVA in study of remembering names: Do people remember names better under different circumstances? In a fictional study, a cognitive psychologist studied memory for names after a group activity that lasted 20 minutes. Participants were not told that this was a study of memory. After the group activity, participants were asked to name the other group members. The researcher randomly assigned 120 participants to one of three conditions: (1) group members introduced themselves once (one introduction only), (2) group members were introduced by the experimenter and by themselves (two introductions), and (3) group members were introduced by the experimenter and themselves and also wore name tags throughout the group activity (two introductions and name tags).
|
Question 11.49
| 11.49 |
Political party and ANOVA: Researchers asked 180 U.S. students to identify their political viewpoint as most similar to that of the Republicans, most similar to that of the Democrats, or neither. All three groups then completed a religiosity scale. The researchers wondered whether political orientation affected levels of religiosity, a measure that assesses how religious one is, regardless of the specific religion with which a person identifies.
|
Question 11.50
| 11.50 |
Exercise and the Tukey HSD test: In How It Works 11.1, we conducted a one- 318 < 5 sessions: 155, 120, 130 5– 9–
|
Question 11.51
| 11.51 |
Grade point average and comparing the t and F distributions: Based on your knowledge of the relation of the t and F distributions, complete the accompanying software output tables. The table for the independent-
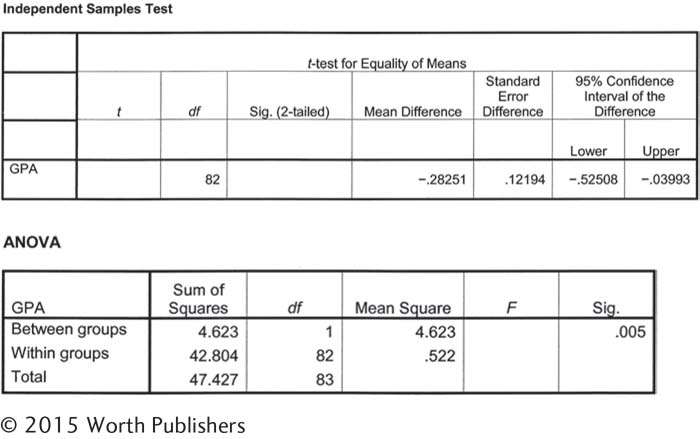
|
Question 11.52
| 11.52 |
Consideration of Future Consequences and two kinds of hypothesis testing: Two samples of students, one comprised of social science majors and one comprised of students with other majors, completed the Consideration of Future Consequences scale (CFC). The accompanying tables include the output from software for an independent-
319 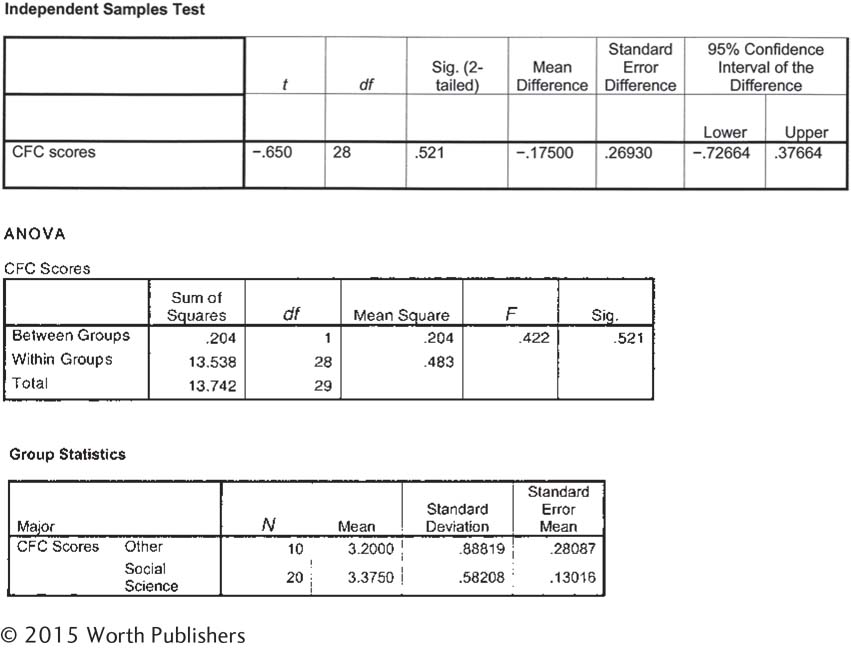
|
Question 11.53
| 11.53 |
Instructors on Facebook and one-
|
Question 11.54
| 11.54 |
Post hoc tests and p values: The most recent version of the Publication Manual of the American Psychological Association (2010) recommends reporting the exact p values for all statistical tests to two decimal places (previously, it recommended reporting p < 0.05 or p > 0.05). Explain how this reporting format allows a reader to more critically interpret the results of post hoc comparisons reported by an author. |
Question 11.55
| 11.55 |
Post hoc tests, bilingualism, and language skills: Researchers Raluca Barac and Ellen Bialystok (2012) conducted a study in which they compared the language skills of 104 six-
|
Question 11.56
| 11.56 |
Romantic love and post hoc tests: Researchers who conducted a study of brain activation and romantic love divided their analyses into two groups (Aron et al., 2005). Some analyses— |
Question 11.57
| 11.57 |
Fear of dogs and one-
|
|||||||||||||||||||||||||
Question 11.58
| 11.58 |
Chewing-
|
||||||||||||||||||||||||||||||||||||
Question 11.59
| 11.59 |
Pessimism and one-
321
|
||||||||||||||||||||||||||||||
Question 11.60
| 11.60 |
Pessimism and one-
|
||||||||||||||||||||||||||||||
Question 11.61
| 11.61 |
Wagging tails and one-
|
Question 11.62
| 11.62 |
Memory, post hoc tests, and effect size: Luo, Hendriks, and Craik (2007) were interested in whether people might better remember lists of words if the lists were paired with either pictures or sound effects. They asked participants to memorize lists of words under three different learning conditions. In the first condition, participants just saw a list of nouns that they were to remember (word-
|
Question 11.63
| 11.63 |
Wagging tails, hypothesis-
|
Question 11.64
| 11.64 |
11.64 Pilots’ mental efforts and a one- 322
|
Putting It All Together
Question 11.65
| 11.65 |
Trust in leadership and one- Employees with low trust in their leader: 9, 14, 11, 18 Employees with moderate trust in their leader: 14, 35, 23 Employees with high trust in their leader: 27, 33, 21, 34
|
Question 11.66
| 11.66 |
Orthodontics and one- Primary school: 16, 13, 18 Junior high school: 8, 13, 14, 12 High school: 20, 15, 16, 18
|
Question 11.67
| 11.67 |
Eye glare, football, and one-
|
Question 11.68
| 11.68 |
ANOVA and taking notes: Researchers studied the type of note-
Because people tend to take notes on their laptops that are verbatim, the researchers speculated that the laptop-
|