Exercises

Clarifying the Concepts

Question 12.1

12.1

What is a two-way ANOVA?

Question 12.2

12.2

What is a factor?

Question 12.3

12.3

In your own words, define the word cell, first as you would use it in everyday conversation and then as a statistician would use it.

Question 12.4

12.4

What is a four-way within-groups ANOVA?

Question 12.5

12.5

What is the difference in information provided when we say two-way ANOVA versus 2 × 3 ANOVA?

Question 12.6

12.6

What are the three different F statistics in a two-way ANOVA?

Question 12.7

12.7

What is a marginal mean?

Question 12.8

12.8

What are the three ways to identify a statistically significant interaction?

Question 12.9

12.9

How do bar graphs help us identify and interpret interactions? Explain how adding lines to the bar graph can help.

Question 12.10

12.10

How do we calculate the between-groups degrees of freedom for an interaction?

Question 12.11

12.11

In step 6 of hypothesis testing for a two-way between-groups ANOVA, we make a decision for each F statistic. What are the three possible outcomes with respect to the overall pattern of results?

Question 12.12

12.12

When are post hoc tests needed for a two-way between-groups ANOVA?

Question 12.13

12.13

Explain the following formula in your own words: SSinteraction = SStotal − (SSrows + SScolumns + SSwithin).

Question 12.14

12.14

In your own words, define the word interaction, first as you would use it in everyday conversation and then as a statistician would use it.

Question 12.15

12.15

What effect-size measure is used with two-way ANOVA?

Calculating the Statistics

Question 12.16

12.16

For each of the following scenarios, what are two names for the ANOVA that would be conducted to analyze the data?

  1. A researcher examined the effect of gender and pet ownership (no pets, one pet, more than one pet) on a measure of loneliness.

  2. In a study on memory, participants completed a memory task once each week for 4 weeks—twice after sleeping 8 hours and twice after sleeping 4 hours. In each sleep condition, the participants completed the task after ingesting a caffeinated beverage and again, on another day, after ingesting a “placebo” beverage that they were told contained caffeine.

  3. A study examined the impact of students’ Facebook profiles on numbers of Facebook friends. The researchers were interested in the effect of the profile photo—either an identifiable photo of the student or a photo of someone or something else—and the effect of relationship status—whether it indicates the student is single or in a relationship.

Question 12.17

12.17

Identify the factors and their levels in the following research designs.

  1. Men and women’s enjoyment of two different sporting events, Sport 1 and Sport 2, are compared using a 20-point enjoyment scale.

  2. The amount of underage drinking, as documented in formal incident reports, is compared at “dry” college campuses (no alcohol at all) and “wet” campuses (those that enforce the legal age for possession of alcohol). Three different types of colleges are considered: state institutions, private schools, and schools with a religious affiliation.

  3. The extent of contact with juvenile authorities is compared for youth across three age groups (12–13, 14–15, 16–17), considering both gender and family composition (two parents, single parent, or no identified authority figure)

Question 12.18

12.18

State how many cells there should be for each of these studies. Then, create an empty grid to represent those cells.

  1. Men and women’s enjoyment of two different sporting events, Sport 1 and Sport 2, are compared using a 20-point enjoyment scale.

  2. The amount of underage drinking, as documented in formal incident reports, is compared at “dry” college campuses (no alcohol at all) and “wet” campuses (those that enforce the legal age for possession of alcohol). Three different types of colleges are considered: state institutions, private schools, and schools with a religious affiliation.

  3. The extent of contact with juvenile authorities is compared for youth across three age groups (12–13, 14–15, 16–17), considering both gender and family composition (two parents, single parent, or no identified authority figure)

Question 12.19

12.19

Use these “enjoyment” data to perform the following:

Ice hockey Figure skating
Men 19, 17, 18, 17 6, 4, 8, 3
Women 13, 14, 18, 8 11, 7, 4, 14
  1. Calculate the cell and marginal means.

  2. Draw a bar graph.

  3. Calculate the five different degrees of freedom, and indicate the critical F value based on each set of degrees of freedom, assuming the p level is 0.01.

  4. Calculate the total sum of squares.

  5. Calculate the between-groups sum of squares for the independent variable gender.

  6. Calculate the between-groups sum of squares for the independent variable sporting event.

  7. Calculate the within-groups sum of squares.

  8. Calculate the sum of squares for the interaction.

  9. Create a source table.

357

Question 12.20

12.20

Use these data—incidents of reports of underage drinking—to perform the following:

“Dry” campus, state school: 47, 52, 27, 50

“Dry” campus, private school: 25, 33, 31

“Wet” campus, state school: 77, 61, 55, 48

“Wet” campus, private school: 52, 68, 60

  1. Calculate the cell and marginal means. Notice the unequal Ns.

  2. Draw a bar graph.

  3. Calculate the five different degrees of freedom, and indicate the critical F value based on each set of degrees of freedom, assuming the p level is 0.05.

  4. Calculate the total sum of squares.

  5. Calculate the between-groups sum of squares for the independent variable campus.

  6. Calculate the between-groups sum of squares for the independent variable school.

  7. Calculate the within-groups sum of squares.

  8. Calculate the sum of squares for the interaction.

  9. Create a source table.

Question 12.21

12.21

Using what you know about the expanded source table, fill in the missing values in the table shown here:

Source SS df MS F
Gender 248.25 1
Parenting style 84.34 3
Gender × style 33.60
Within 1107.2 36
Total

Question 12.22

12.22

Using the information in the source table provided here, compute R2 values for each effect. Using Cohen’s conventions, explain what these values mean.

Source SS df MS F
A (rows) 0.267 1 0.267 0.004
B (columns) 3534.008 2 1767.004 24.432
A × B 5.371 2 2.686 0.037
Within 1157.167 16 72.323
Total 4696.813 21

Question 12.23

12.23

Using the information in the source table provided here, compute R2 values for each effect. Using Cohen’s conventions, explain what these values mean.

Source SS df MS F
A (rows) 30.006 1 30.006 0.511
B (columns) 33.482 1 33.482 0.570
A × B 1.720 1 1.720 0.029
Within 587.083 10 58.708
Total 652.291 13

Applying the Concepts

Question 12.24

12.24

Football, eye glare, and ANOVA: In Exercise 11.67 (page 322), we described a Yale University study. Let’s consider a redesign in which researchers randomly assigned 46 participants to place one of three substances below their eyes: black grease, black antiglare stickers, or petroleum jelly. They assessed eye glare using a contrast chart that gives a value for each participant, a scale measure. Black grease led to a reduction in glare compared with the two other conditions, antiglare stickers or petroleum jelly (DeBroff & Pahk, 2003). Imagine that every participant was tested twice, once in broad daylight and again under the artificial lights used at night.

  1. What are the independent variables and their levels?

  2. What kind of ANOVA would we use?

Question 12.25

12.25

Health-related myths and the type of ANOVA: Consider the study we used as an example for a two-way between-groups ANOVA. Older and younger people were randomly assigned to hear either one repetition or three repetitions of a health-related myth, accompanied by the accurate information that “busted” the myth.

  1. Explain why this study would be analyzed with a between-groups ANOVA.

  2. How could this study be redesigned to use a within-groups ANOVA? (Hint: Think long term.)

Question 12.26

12.26

Memory and choosing the type of ANOVA: In a fictional study, a cognitive psychologist studied memory for names after a group activity. The researcher randomly assigned 120 participants to one of three conditions: (1) group members introduced themselves once, (2) group members were introduced by the experimenter and by themselves, and (3) group members were introduced by the experimenter and themselves, and they wore name tags throughout the group activity.

  1. How could the researcher redesign this study so it would be analyzed with a two-way between-groups ANOVA? Be specific. (Note: There are several possible ways that the researcher could do this.)

  2. How could the researcher redesign this study so it would be analyzed with a two-way mixed-design ANOVA? Be specific. (Note: There are several possible ways the researcher could do this.)

358

Question 12.27

12.27

Age, online dating, and choosing the type of ANOVA: A researcher wondered about the degree to which age was a factor for those posting personal ads on Match.com. He randomly selected 200 ads and examined data about the posters (the people who posted the ads). Specifically, for each ad, he calculated the difference between the poster’s age and the oldest acceptable age in a romantic prospect. So, if someone were 23 years old and would date someone as old as 30, his or her score would be 7; if someone were 25 and would date someone as old as 23, his or her score would be −2. The researcher then categorized the scores into male versus female and seeking a same-sex date versus seeking an opposite-sex date.

  1. List any independent variables, along with the levels.

  2. What is the dependent variable?

  3. What kind of ANOVA would he use?

  4. Now name the ANOVA using the more specific language that enumerates the numbers of levels.

  5. Use your answer to part (d) to calculate the number of cells. Explain how you made this calculation.

  6. Draw a table that depicts the cells of this ANOVA.

Question 12.28

12.28

Racism, juries, and interactions: In a study of racism, Nail, Harton, and Decker (2003) had participants read a scenario in which a police officer assaulted a motorist. Half the participants read about an African American officer who assaulted a European American motorist, and half read about a European American officer who assaulted an African American motorist. Participants were categorized based on political orientation: liberal, moderate, or conservative. Participants were told that the officer was acquitted of assault charges in state court but was found guilty of violating the motorist’s rights in federal court. Double jeopardy occurs when an individual is tried twice for the same crime. Participants were asked to rate, on a scale of 1–7, the degree to which the officer had been placed in double jeopardy by the second trial.

The researchers reported the interaction as F(2, 58) = 10.93, p < 0.0001. The means for the liberal participants were 3.18 for those who read about the African American officer and 1.91 for those who read about the European American officer. The means for the moderate participants were 3.50 for those who read about the African American officer and 3.33 for those who read about the European American officer. The means for the conservative participants were 1.25 for those who read about the African American officer and 4.62 for those who read about the European American officer.

  1. Draw a table of cell means that includes the actual means for this study.

  2. Do the reported statistics indicate that there is a significant interaction? If yes, describe the interaction in your own words.

  3. Draw a bar graph that depicts the interaction. Include lines that connect the tops of the bars and show the pattern of the interaction.

  4. Is this a quantitative or qualitative interaction? Explain.

  5. Change the cell mean for the conservative participants who read about an African American officer so that this is now a quantitative interaction.

  6. Draw a bar graph that depicts the pattern that includes the new cell means.

  7. Change the cell means for the moderate and conservative participants who read about an African American officer so that there is now no interaction.

  8. Draw a bar graph that depicts the pattern that includes the new cell means.

Question 12.29

12.29

Self-interest, ANOVA, and interactions: Ratner and Miller (2001) wondered whether people are uncomfortable when they act in a way that’s not obviously in their own self-interest. They randomly assigned 33 women and 32 men to read a fictional passage saying that federal funding would soon be cut for research into a gastrointestinal illness that mostly affected either (1) women or (2) men. They were then asked to rate, on a 1–7 scale, how comfortable they would be “attending a meeting of concerned citizens who share your position” on this cause (p. 11). A higher rating indicates a greater degree of comfort. The journal article reported the statistics for the interaction as F(1, 58) = 9.83, p < 0.01. Women who read about women had a mean of 4.88, whereas those who read about men had a mean of 3.56. Men who read about women had a mean of 3.29, whereas those who read about men had a mean of 4.67.

  1. What are the independent variables and their levels? What is the dependent variable?

  2. What kind of ANOVA did the researchers conduct?

  3. Do the reported statistics indicate that there is a significant interaction? Explain your answer.

  4. Draw a table that includes the cells of the study. Include the cell means.

  5. Draw a bar graph that depicts these findings.

  6. Describe the pattern of the interaction in words. Is this a qualitative or a quantitative interaction? Explain your answer.

  7. Draw a new table of cells, but change the means for male participants reading about women so that there is now a quantitative, rather than a qualitative, interaction.

  8. Draw a bar graph of the means in part (g).

  9. Draw a new table of cells, but change the means for male participants reading about women so that there is no interaction.

359

Question 12.30

12.30

Gender, negotiating a salary, and an interaction: Eleanor Barkhorn (2012) reported in the Atlantic about differences in women’s and men’s negotiating styles. She first explained that researchers did not find a significant difference in how likely women and men are to negotiate salaries. But this did not tell the whole story. Barkhorn wrote: “Women are more likely to negotiate when an employer explicitly says that wages are negotiable. Men, on the other hand, are more likely to negotiate when the employer does not directly state that they can negotiate.”

For each of the following, state whether the finding is a result of examining a main effect or examining an interaction. Explain your answer.

  1. The finding that women and men do not significantly differ, on average, in their likelihood of negotiating.

  2. The finding of a gender difference in the circumstances under which one will negotiate.

Question 12.31

12.31

The cross-race effect, main effects, and interactions: Hugenberg, Miller, and Claypool (2007) conducted a study to better understand the cross-race effect, in which people have a difficult time recognizing members of different racial groups—colloquially known as the “they all look the same to me” effect. In a variation on this study, white participants viewed either 20 black faces or 20 white faces for 3 seconds each. Half the participants were told to pay particular attention to distinguishing features of the faces. Later, participants were shown 40 black faces or 40 white faces (the same race that they were shown in the prior stage of the experiment), 20 of which were new. Each participant received a score that measured his or her recognition accuracy.

The researchers reported two effects, one for the race of the people in the pictures, F(1, 136) = 23.06, p <0.001, such that white faces were more easily recognized, on average, than black faces. There also was a significant interaction of the race of the people in the pictures and the instructions, F(1, 136) = 5.27, p < 0.05. When given no instructions, the mean recognition scores were 1.46 for white faces and 1.04 for black faces. When given instructions to pay attention to distinguishing features, the mean recognition scores were 1.38 for white faces and 1.23 for black faces.

  1. What are the independent variables and their levels? What is the dependent variable?

  2. What kind of ANOVA did the researchers conduct?

  3. Do the reported statistics indicate that there is a significant main effect? If yes, describe it.

  4. Why is the main effect not sufficient in this situation to understand the findings? Be specific about why the main effect is misleading by itself.

  5. Do the reported statistics indicate that there is a significant interaction? Explain your answer.

  6. Draw a table that includes the cells of the study and the cell means.

  7. Draw a bar graph that depicts these findings.

  8. Describe the pattern of the interaction in words. Is this a qualitative or a quantitative interaction? Explain your answer.

Question 12.32

12.32

Grade point average, fraternities, sororities, and two-way between-groups ANOVA: A sample of students from our statistics classes reported their GPAs, indicated their genders, and stated whether they were in the university’s Greek system (i.e., in a fraternity or sorority). Following are the GPAs for the different groups of students:

Men in a fraternity: 2.6, 2.4, 2.9, 3.0

Men not in a fraternity: 3.0, 2.9, 3.4, 3.7, 3.0

Women in a sorority: 3.1, 3.0, 3.2, 2.9

Women not in a sorority: 3.4, 3.0, 3.1, 3.1

  1. What are the independent variables and their levels? What is the dependent variable?

  2. Draw a table that lists the cells of the study design. Include the cell means.

  3. Conduct all six steps of hypothesis testing.

  4. Draw a bar graph for all statistically significant effects.

  5. Is there a significant interaction? If yes, describe it in words and indicate whether it is a qualitative or a quantitative interaction. Explain.

  6. Compute the effect sizes, R2, for the main effects and interaction. Using Cohen’s conventions, interpret the effect-size values.

Question 12.33

12.33

Age, online dating, and two-way between-groups ANOVA: The data below were from the same 25-year-old participants described in How It Works 12.1, but now the scores represent the oldest age that would be acceptable in a dating partner.

25-year-old women seeking men: 40, 35, 29, 35, 35

25-year-old men seeking women: 26, 26, 28, 28, 28

25-year-old women seeking women: 35, 35, 30, 35, 45

25-year-old men seeking men: 33, 35, 35, 36, 38

  1. What are the independent variables and their levels? What is the dependent variable?

  2. Draw a table that lists the cells of the study design. Include the cell means.

  3. Conduct all six steps of hypothesis testing.

  4. Is there a significant interaction? If yes, describe it in words, indicate whether it is a quantitative or a qualitative interaction, and draw a bar graph.

  5. Compute the effect sizes, R2, for the main effects and interaction. Using Cohen’s conventions, interpret the effect-size values.

360

Question 12.34

12.34

Helping, payment, and two-way between-groups ANOVA: Heyman and Ariely (2004) were interested in whether effort and willingness to help were affected by the form and amount of payment offered in return for effort. They predicted that when money was used as payment, in what is called a money market, effort would increase as a function of payment level. On the other hand, if effort were performed out of altruism, in what is called a social market, the level of effort would be consistently high and unaffected by level of payment. In one of their studies, college students were asked to estimate another student’s willingness to help load a sofa into a van in return for a cash payment or candy of equivalent value. Willingness to help was assessed using an 11-point scale ranging from “Not at all likely to help” to “Will help for sure.” Data are presented here to re-create some of their findings.

Cash payment, low amount of $0.50: 4, 5, 6, 4

Cash payment, moderate amount of $5.00: 7, 8, 8, 7

Candy payment, low amount valued at $0.50: 6, 5, 7, 7

Candy payment, moderate amount valued at $5.00: 8, 6, 5, 5

  1. What are the independent variables and their levels?

  2. What is the dependent variable?

  3. Draw a table that lists the cells of the study design. Include the cell and marginal means.

  4. Create a bar graph.

  5. Using this graph and the table of cell means, describe what effects you see in the pattern of the data.

  6. Write the null and research hypotheses.

  7. Complete all of the calculations and construct a full source table for these data.

  8. Determine the critical value for each effect at a p level of 0.05.

  9. Make your decisions. Is there a significant interaction? If yes, describe it in words and indicate whether it is a qualitative or a quantitative interaction. Explain.

  10. Compute the effect sizes, R2, for the main effects and interaction. Using Cohen’s conventions, interpret the effect-size values.

Question 12.35

12.35

Helping, payment, and interactions: Expanding on the work of Heyman and Ariely (2004) as described in the previous exercise, let’s assume a higher level of payment was included and the following data were collected. (Notice that all data are the same as earlier, with the addition of new data under a high payment amount.)

Cash payment, low amount of $0.50: 4, 5, 6, 4

Cash payment, moderate amount of $5.00: 7, 8, 8, 7

Cash payment, high amount of $50.00: 9, 8, 7, 8

Candy payment, low amount, valued at $0.50: 6, 5, 7, 7

Candy payment, moderate amount, valued at $5.00: 8, 6, 5, 5

Candy payment, high amount, valued at $50.00: 6, 7, 7, 6

  1. What are the independent variables and their levels? What is the dependent variable?

  2. Draw a table that lists the cells of the study design. Include the cell and marginal means.

  3. Create a new bar graph of these data.

  4. Do you think there is a significant interaction? If yes, describe it in words.

  5. Now that one independent variable has three levels, what additional analyses are needed? Explain what you would do and why. Based on the graph you created, where do you think there would be significant differences?

Question 12.36

12.36

Exercise, well-being, and type of ANOVA: Cox, Thomas, Hinton, and Donahue (2006) studied the effects of exercise on well-being. There were three independent variables: age (18–20 years old, 35–45 years old), intensity of exercise (low, moderate, high), and time point (15, 20, 25, and 30 minutes). The dependent variable was positive well-being. Every participant was assessed at all intensity levels and all time points. (Generally, moderate-intensity exercise and high-intensity exercise led to higher levels of positive well-being than did low-intensity exercise.) What type of ANOVA would the researchers conduct?

Question 12.37

12.37

Negotiation, an interaction, and a graph: German psychologist David Loschelder and his colleagues conducted an experiment on negotiations (2014). They cited tennis player Andy Roddick’s agent who thought it was always detrimental to make an initial offer, saying “The first offer gives you an insight into their [the other party’s] thought process.” The researchers wondered if this was always true. So, they conducted an experiment with two independent variables. One independent variable was the person’s role in the negotiations—either the person starting the negotiation (the sender) or the person being targeted (the receiver). The second independent variable was the type of information in the initial offer—different or the same. That is, the sender was either asking for something that is different from what the other partner wants or asking for something that the other person also wants. For example, if you are negotiating with a new employer, you might ask for five weeks of vacation and a higher salary than you think you can get. And maybe the employer was already prepared to give you five weeks vacation. So, the researchers thought the type of information that matches what the other person wants (like the information about vacation time) might give the receiver a bargaining chip. Knowing what the sender really wants might let you lowball on other aspects of the negotiation. So, the employer can then grant the vacation time, and perhaps not have to offer the higher salary. The graph here depicts the results of this experiment, in which success in the negotiation was measured in the percentage of a pool of money that could be earned.

361

image
  1. Based on this graph, what type of ANOVA did the researchers conduct?

  2. Does it seem as if there’s a main effect of role in the negotiations (sender or receiver)? If yes, explain the effect in your own words. If not, explain your answer.

  3. Does it seem as if there’s a main effect of type of information provided? If yes, explain the effect in your own words? If not, explain your answer.

  4. Describe the interaction in your own words. Is this a quantitative interaction or a qualitative interaction? Explain your answer.

  5. Based on what you learned about graphing in Chapter 3, explain an important problem with the y-axis.

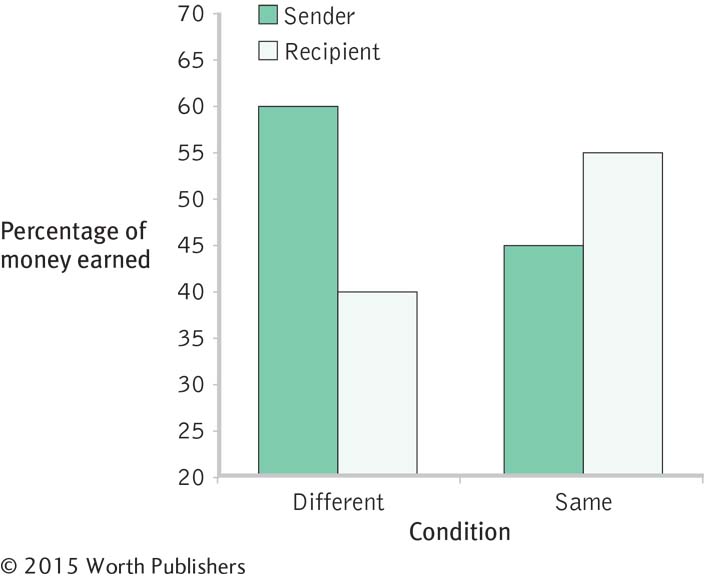
Putting It All Together

Question 12.38

12.38

Skepticism, self-interest, and two-way ANOVA: A study on motivated skepticism examined whether participants were more likely to be skeptical when it served their self-interest (Ditto & Lopez, 1992). Ninety-three participants completed a fictitious medical test that told them they had high levels of a certain enzyme, TAA. Participants were randomly assigned to be told either that high levels of TAA had potentially unhealthy consequences or potentially healthy consequences. They were also randomly assigned to complete a dependent measure before or after the TAA test. The dependent measure assessed their perception of the accuracy of the TAA test on a scale of 1 (very inaccurate) to 9 (very accurate). Ditto and Lopez found the following means for those who completed the dependent measure before taking the TAA test: unhealthy result, 6.6; healthy result, 6.9. They found the following means for those who completed the dependent measure after taking the TAA test: unhealthy result, 5.6; healthy result, 7.3. From their ANOVA, they reported statistics for two findings. For the main effect of test outcome, they reported the following statistic: F(1,73) = 7.74, p < 0.01. For the interaction of test outcome and timing of the dependent measure, they reported the following statistic: F(1, 73) = 4.01, p < 0.05.

  1. State the independent variables and their levels. State the dependent variable.

  2. What kind of ANOVA would be used to analyze these data? State the name using the original language as well as the more specific language.

  3. Use the more specific language of ANOVA to calculate the number of cells in this research design.

  4. Draw a table of cell means, marginal means, and the grand mean. Assume that equal numbers of participants were assigned to each cell (even though this was not the case in the actual study).

  5. Describe the significant main effect in your own words.

  6. Draw a bar graph that depicts the main effect.

  7. Why is the main effect misleading by itself?

  8. Is the main effect qualified by a statistically significant interaction? Explain. Describe the interaction in your own words.

  9. Draw a bar graph that depicts the interaction. Include lines that connect the tops of the bars and show the pattern of the interaction.

  10. Is this a quantitative or qualitative interaction? Explain.

  11. Change the cell mean for the participants who had a healthy test outcome and completed the dependent measure before the TAA test so that this is now a qualitative interaction.

  12. Draw a bar graph depicting the pattern that includes the new cell mean.

  13. Change the cell mean for the participants who had a healthy test outcome and completed the dependent measure before the TAA test so that there is now no interaction.

  14. Draw a bar graph that depicts the pattern that includes the new cell mean.

Question 12.39

12.39

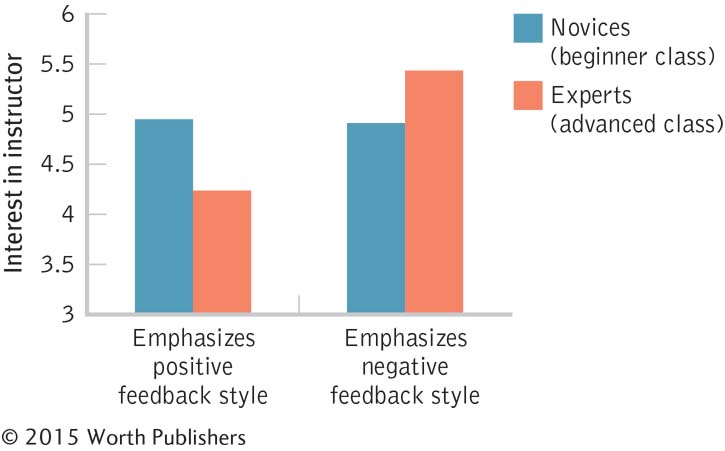
Feedback and ANOVA: Stacey Finkelstein and Ayelet Fishbach (2012) examined the impact of feedback in the learning process. The following is an excerpt from their abstract: “This article explores what feedback people seek and respond to. We predict and find a shift from positive to negative feedback as people gain expertise. We document this shift in a variety of domains, including feedback on language acquisition, pursuit of environmental causes, and use of consumer products. Across these domains, novices sought and responded to positive feedback, and experts sought and responded to negative feedback” (p. 22).

  1. Based on the abstract, what are the independent variables and what are their levels?

  2. What are possible dependent variables, based on the description in the abstract?

  3. The researchers conducted several experiments, one of which examined students in beginning and advanced French classes. Here is the result of one analysis: “The analysis also yielded the predicted expertise ´ feedback interaction (F(1,79) = 7.31, p < .01). Is this interaction statistically significant? Explain your answer.

  4. What important statistic is missing from their report? Why would it be helpful to include this statistic?

  5. The results in part (c) are represented by the graph here. We would, of course, have to conduct additional analyses to know exactly which bars are significantly different from each other. That said, what does the overall pattern seem to indicate for this analysis?

  6. How would you redesign this graph in line with what you learned in Chapter 3? Give at least two specific suggestions.

image

362