SPSS®
SPSS is divided into two main screens. The easiest way to move back and forth between these two screens is by using the two tabs located at the lower left labeled “Variable View” and “Data View.”
To name the variables, go to “Variable View” and select:
Name. Type in a short version of the variable name—
Type. For nominal variables, such as gender, change the type to “String” by clicking the cell in the column labeled “Type” or by clicking the little gray box, choosing “String,” and clicking “OK.”
To tell SPSS what the variable name means, select:
Label. Type in the full name of the variable, such as Beck Depression Inventory.
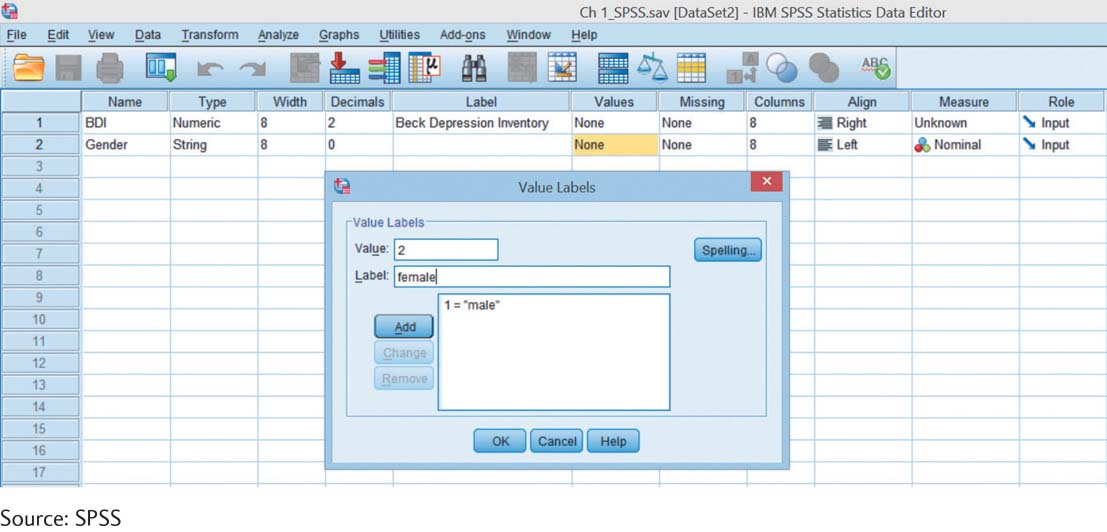
To tell SPSS what the numbers assigned to any nominal variable actually mean, select:
Values. In the column labeled “Values,” click on the cell next to the appropriate variable, then click on the little gray box on the right of that cell to access the tool that allows you to identify the values (or levels) of the variables. For example, if the nominal variable “gender” is part of the study, tell SPSS that 1 equals male and 2 equals female. The numbers are the values and the words are the labels. See the accompanying screenshot to see what this looks like.
Now tell SPSS what kind of variables these are by selecting:
Measure. Highlight the type of variable by clicking on the cell in the column labeled “Measure” next to each variable, then clicking on the arrow to access the tool that allows you to identify whether the variable is scale, ordinal, or nominal. This is not necessary for nominal variables if the type is already listed as “String.”
After describing all of the variables in the study in “Variable View,” switch over to “Data View.” The information you entered was automatically transferred to that screen, but now the variables are displayed across the tops of the columns instead of along the left-