2.2 Shapes of Distributions
35
We learned how to organize data so that we can better understand the concept of a distribution, a major building block for statistical analysis. We can’t get a sense of the overall pattern of data by looking at a list of numbers, but we can get a sense of the pattern by looking at a frequency table. We can get an even better sense by creating a graph. Histograms and frequency polygons allow us to see the overall pattern, or shape, of the distribution of data.
The shape of a distribution provides distinctive information. For example, when the U.S.-based General Social Survey (a large data set available to the public via the Internet) asked people about the influence of children’s programming—
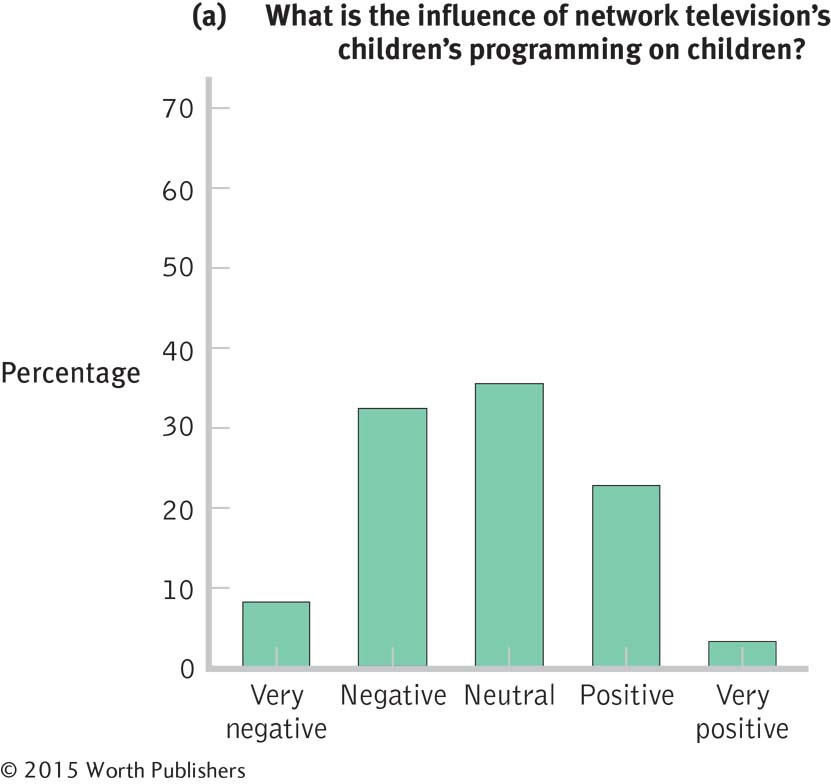
The Influence of Television Programming on Children
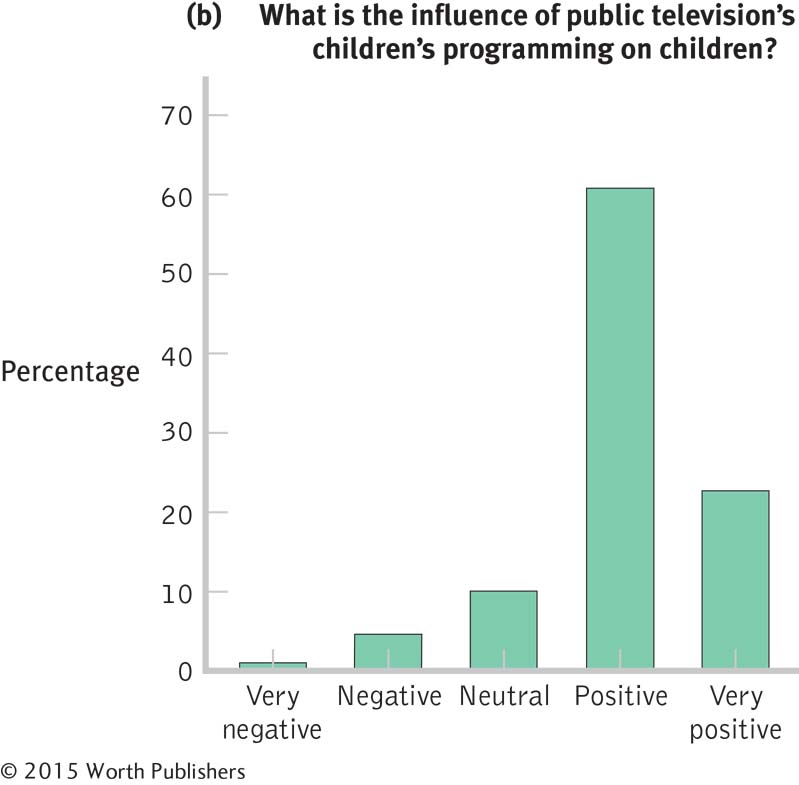
These two histograms tell different stories about the perceptions of the influence of television programming on children. The first histogram (a) describes the influence of network television on children; the second histogram (b) describes the influence of public television on children.
Normal Distributions
A normal distribution is a specific frequency distribution that is a bell-
shaped, symmetric, unimodal curve.
Many, but not all, distributions of variables form a bell-
Skewed Distributions
36
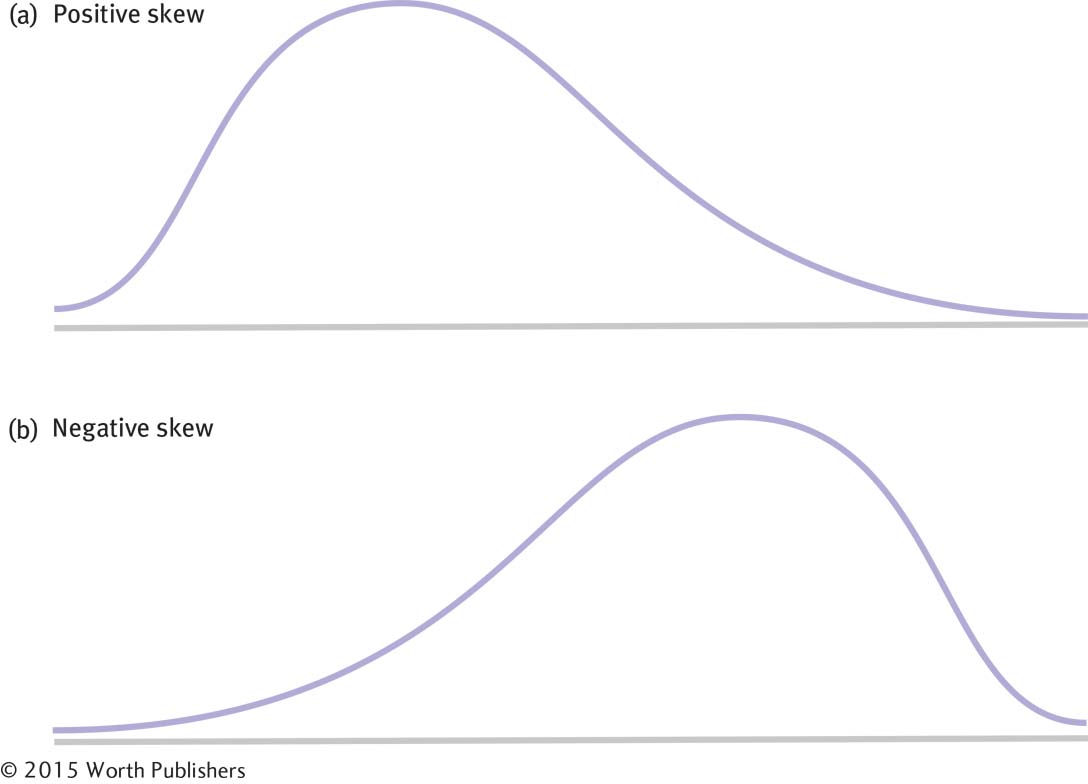
A skewed distribution is a distribution in which one of the tails of the distribution is pulled away from the center.
Reality is often—
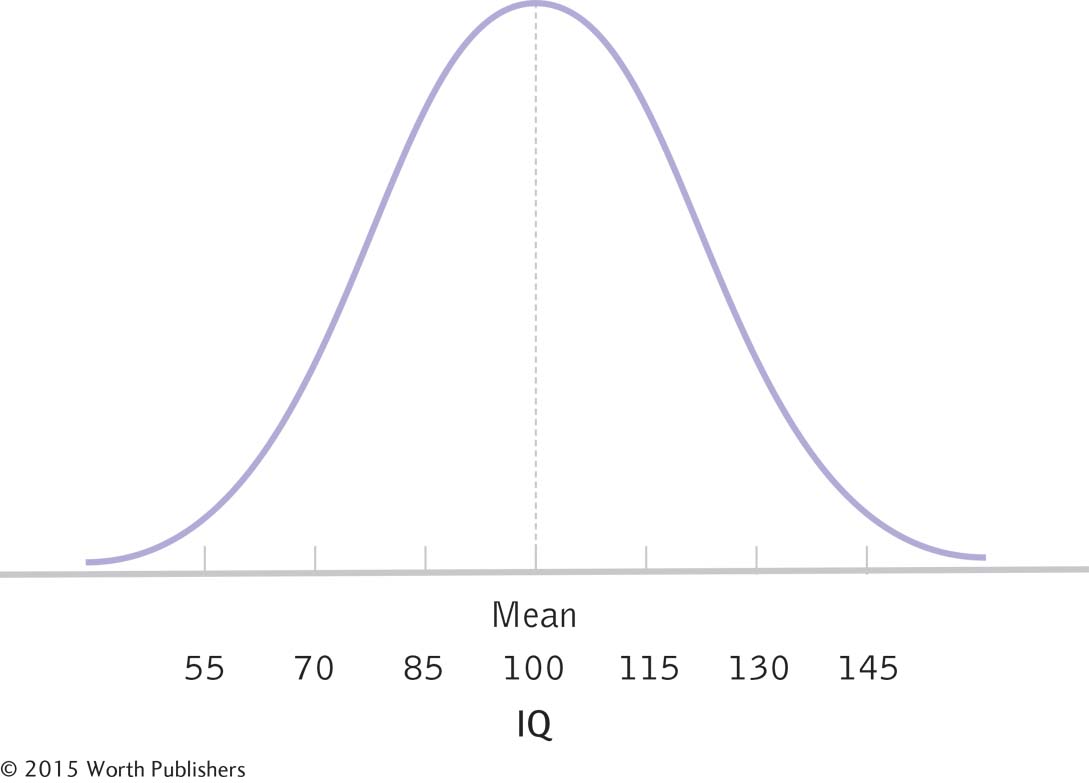
The Normal Distribution
The normal distribution, shown here for IQ scores, is a frequency distribution that is bell-
With positively skewed data, the distribution’s tail extends to the right, in a positive direction.
A floor effect is a situation in which a constraint prevents a variable from taking values below a certain point.
When a distribution is positively skewed, as in Figure 2-6a, the tail of the distribution extends to the right, in a positive direction. Positive skew sometimes occurs when there is a floor effect, a situation in which a constraint prevents a variable from taking values below a certain point. For example, in the “World Cup success” data, scores indicating how many countries came in first or second in the World Cup a certain number of times is an example of a positively skewed distribution with a floor effect. Most countries never came in first or second, which means that the data were constrained at the lower end of the distribution, 0 (that is, they can’t go below 0).
Two Kinds of Skew
The mnemonic “the tail tells the tale” means that the distribution with the long, thin tail to the right is positively skewed and the distribution with the long, thin tail to the left is negatively skewed.
MASTERING THE CONCEPT
2-
Negatively skewed data have a distribution with a tail that extends to the left, in a negative direction.
A ceiling effect is a situation in which a constraint prevents a variable from taking on values above a given number.
37
The distribution in Figure 2-6b shows negatively skewed data, which have a distribution with a tail that extends to the left, in a negative direction. The distribution of people’s attitudes toward public television’s programming of children’s shows is favorable because it is clustered around the word positive, but we describe the shape of that distribution as negatively skewed because the thin tail is to the left side of the distribution. Not surprisingly, negative skew is sometimes the result of a ceiling effect, a situation in which a constraint prevents a variable from taking on values above a given number. If a professor gives an extremely easy quiz, then the quiz scores might show a ceiling effect. A number of students would cluster around 100, the highest possible score, with a few stragglers down in the lower end.
CHECK YOUR LEARNING
| Reviewing the Concepts |
|
|
| Clarifying the Concepts | 2- |
Distinguish a normal distribution from a skewed distribution. |
| 2- |
When the bulk of data cluster together but the data trail off to the left, the skew is _________; when that data trail off to the right, the skew is _________. | |
| Calculating the Statistics | 2- |
In Check Your Learning 2- |
| 2- |
Alzheimer’s disease is typically diagnosed in adults above the age of 70; cases diagnosed sooner are called “early onset.”
|
|
| Applying the Concepts | 2- |
Referring to Check Your Learning 2- |
Solutions to these Check Your Learning questions can be found in Appendix D.