4.4 SPSS®

The left-hand column in “Data View” is prenumbered, beginning with 1. Each column to the right of that number contains information about a particular variable; each row across from that number represents a unique individual (or country, in this case). Notice the choices at the top of the “Data View” screen. Enter the data for countries’ top finishes in the World Cup, omitting countries with a score of 0: 10, 8, 6, 4, 3, 3, 2, 2, 2, 2, 2, 2, 1, 1, 1, and 1, as shown on the left of the screenshot below.

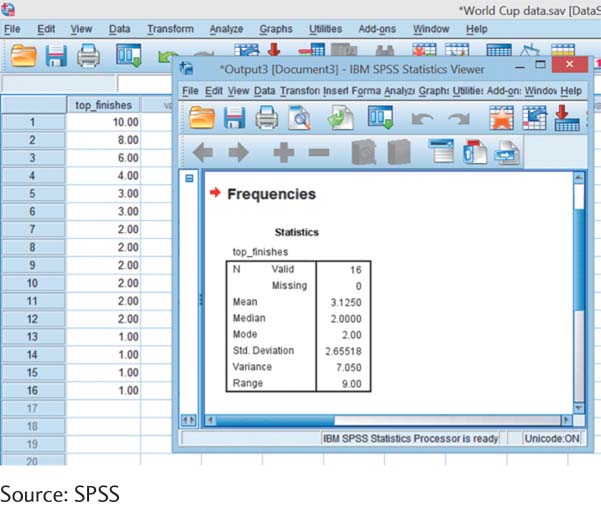
To get a numerical description of a variable, select: Analyze → Descriptive Statistics → Frequencies. Then select the variable of interest, “top_finishes,” by highlighting it and then clicking the arrow to move it from the left side to the right side. Then select: Statistics → Mean, Median, Mode, Std. Deviation, Variance, Range → Continue → OK.

Your data and output will look like those in the screenshot shown here.

image
Source: SPSS