6.2 Standardization, z Scores, and the Normal Curve
129
Standardization is a way to convert individual scores from different normal distributions to a shared normal distribution with a known mean, standard deviation, and percentiles.
De Moivre’s discovery of the normal curve meant that scientists could now make meaningful comparisons. Why? When data are normally distributed, we can compare one particular score to an entire distribution of scores. To do this, we convert a raw score to a standardized score (for which percentiles are already known). Standardization is a way to convert individual scores from different normal distributions to a shared normal distribution with a known mean, standard deviation, and percentiles.
130
In this section, we explain the importance of standardization and introduce the tool that helps us standardize, the z score. We show how we can convert raw scores to z scores, and z scores to raw scores. We demonstrate how the distribution of z scores allows us to know what percentage of the population falls above or below a given z score.
The Need for Standardization
A z score is the number of standard deviations a particular score is from the mean.
MASTERING THE CONCEPT
6-
One of the first problems with making meaningful comparisons is that variables are measured on different scales. For example, we measure height in inches but measure weight in pounds. In order to compare heights and weights, we need a way to put different variables on the same standardized scale. Fortunately, we can standardize different variables by using their means and standard deviations to convert any raw score into a z score. A z score is the number of standard deviations a particular score is from the mean. A z score is part of its own distribution, the z distribution, just as a raw score, such as a person’s height, is part of its own distribution, a distribution of heights. (Note that as with all statistical symbols, the z is italicized.)
EXAMPLE 6.2
Here is a memorable example of standardization: comparing weights of cockroaches. Different countries use different measures of weight. In the United Kingdom and the United States, the pound is typically used, with variants that are fractions or multiples of the pound, such as the dram, ounce, and ton. In most other countries, the metric system is used, with the gram as the basic unit of weight, and variants that are fractions or multiples of the gram, such as the milligram and kilogram.

If we were told that three imaginary species of cockroaches had mean weights of 8.0 drams, 0.25 pound, and 98.0 grams, which one should we most fear? We can answer this question by standardizing the weights and comparing them on the same measure. A dram is 1/256 of a pound, so 8.0 drams is 1/32 = 0.03125 of a pound. One pound equals 453.5924 grams. Based on these conversions, the weights could be standardized into grams as follows:
Cockroach 1 weighs 8.0 drams = 0.03125 pound = 14.17 grams
Cockroach 2 weighs 0.25 pound = 113.40 grams
Cockroach 3 weighs 98.00 grams
Standardizing allows us to determine that the second cockroach species tends to weigh the most: 113.40 grams. Fortunately, the biggest cockroach in the world weighs only about 35 grams and is about 80 millimeters (3.15 inches) long. Cockroaches 2 and 3 exist only in our imaginations. However, not all conversions are as easy as standardizing weights from different units into grams. That’s why statisticians developed the z distribution.
Transforming Raw Scores into z Scores
A desire to make meaningful comparisons forces us to convert raw scores into standardized scores. For example, let’s say you know that after taking the midterm examination, you are 1 standard deviation above the mean in your statistics class. Is this good news? What if you are 0.5 standard deviation below the mean? Understanding a score’s relation to the mean of its distribution gives us important information. For a statistics test, we know that being above the mean is good; for anxiety levels, we know that being above the mean is usually bad. z scores create an opportunity to make meaningful comparisons.
131
The only information we need to convert any raw score to a z score is the mean and standard deviation of the population of interest. In the midterm example above, we are probably interested in comparing our grade with the grades of others in this course. In this case, the statistics class is the population of interest. Let’s say that your score on the midterm is 2 standard deviations above the mean; your z score is 2.0. Imagine that a friend’s score is 1.6 standard deviations below the mean; your friend’s z score is −1.6. What would your z score be if you fell exactly at the mean in your statistics class? If you guessed 0, you’re correct.
Figure 6-5 illustrates two important features of the z distribution. First, the z distribution always has a mean of 0. So, if you are exactly at the mean, then you are 0 standard deviations from the mean. Second, the z distribution always has a standard deviation of 1. If your raw score is 1 standard deviation above the mean, you have a z score of 1.0.
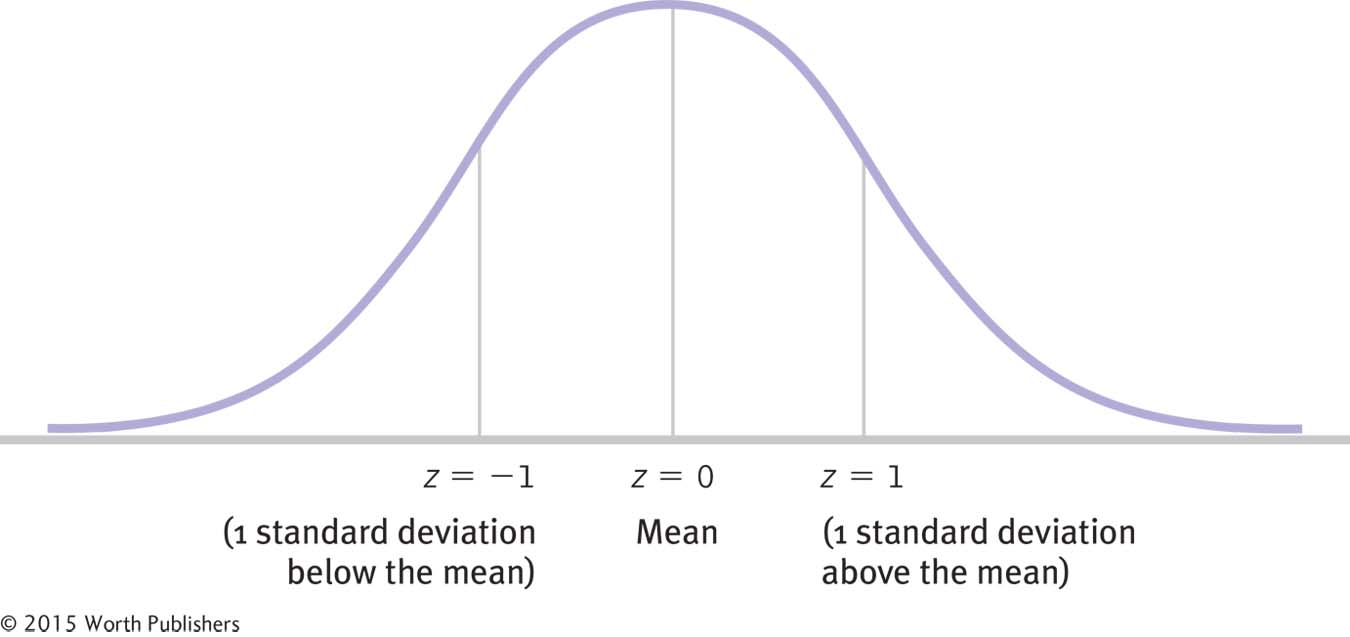
The z Distribution
The z distribution always has a mean of 0 and a standard deviation of 1.
EXAMPLE 6.3
Let’s calculate z scores without a calculator or formula. We’ll use the distribution of scores on a statistics exam. (This example is illustrated in Figure 6-6.) If the mean on a statistics exam is 70, the standard deviation is 10, and your score is 80, what is your z score? In this case, you are exactly 10 points, or 1 standard deviation, above the mean, so your z score is 1.0. Now let’s say your score is 50, which is 20 points, or 2 standard deviations, below the mean, so your z score is −2.0. What if your score is 85? Now you’re 15 points, or 1.5 standard deviations, above the mean, so your z score is 1.5.
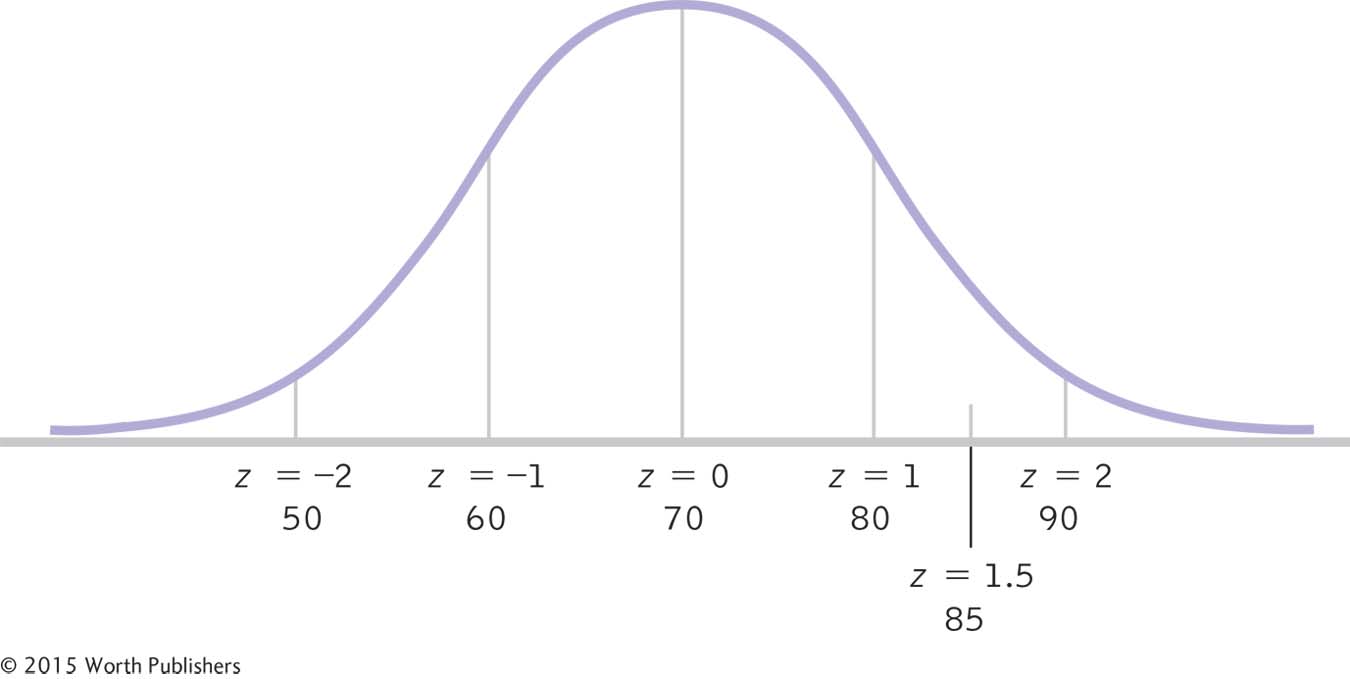
z Scores Intuitively
With a mean of 70 and a standard deviation of 10, we can calculate many z scores without a formula. A raw score of 50 has a z score of −2.0. A raw score of 60 has a z score of −1.0. A raw score of 70 has a z score of 0. A raw score of 80 has a z score of 1.0. A raw score of 85 has a z score of 1.5.
132
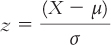
As you can see, we don’t need a formula to calculate a z score when we’re working with easy numbers. It is important, however, to learn the notation and language of statistics. So let’s also convert z scores using a formula for when the numbers are not easy to work with. To calculate a particular z score, there are just two steps.
STEP 1: Determine the distance of a particular person’s score (X ) from the population mean ( μ) as part of the calculation: X − μ.
STEP 2: Express this distance in terms of standard deviations by dividing by the population standard deviation, σ.
The formula, therefore, is:
MASTERING THE FORMULA
6-
.
We calculate the difference between an individual score and the population mean, then divide by the population standard deviation.
EXAMPLE 6.4
Let’s take an example that is not so easy to calculate in our heads. The mean height for the population of sophomores at your university is 64.886, with a standard deviation of 4.086. If you are 70 inches tall, what is your z score?
STEP 1: Subtract the population mean from your score.
In this case, subtract the population mean, 64.886, from your score, 70.
STEP 2: Divide by the population standard deviation.
The population standard deviation is 4.086. Here are those steps in the context of the formula:
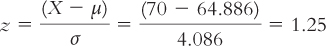
You are 1.25 standard deviations above the mean.
We must be careful not to use a formula mindlessly. Always consider whether the answer makes sense. In this case, 1.25 is positive, indicating that the height is just over 1 standard deviation above the mean. This makes sense because the raw score of 70 is also just over 1 standard deviation above the mean. If you do this quick check regularly, then you can correct mistakes before they cost you.
EXAMPLE 6.5
Let’s take another example: What if you are 62 inches tall?
STEP 1: Subtract the population mean from your score.
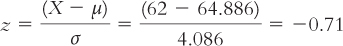
Here, subtract the population mean, 64.886, from your score, 62.
STEP 2: Divide by the population standard deviation.
The population standard deviation is 4.086. Here are those steps in the context of the formula:
133
You are 0.71 standard deviation below the mean.
Don’t forget the sign of the z score. Changing a z score from negative 0.71 to positive 0.71 makes a big difference!

EXAMPLE 6.6
With the height example we’ve been using, let’s now demonstrate that the mean of the z distribution is always 0 and the standard deviation is always 1. The mean is 64.886 and the standard deviation is 4.086. Let’s calculate what the z score would be at the mean.
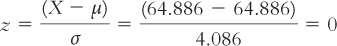
STEP 1: Subtract the population mean from a score right at the mean.
We subtract the population mean, 64.886, from a score right at the mean, 64.886.
STEP 2: Divide by the population standard deviation.
We divide the difference by 4.086. Here are those steps in the context of the formula:
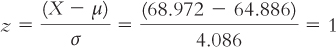
If someone is exactly 1 standard deviation above the mean, his or her score would be 64.886 + 4.086 = 68.972. Let’s calculate what the z score would be for this person.
STEP 1: Subtract the population mean from a score exactly 1 standard deviation above the mean.
We subtract the population mean, 64.886, from a score exactly 1 standard deviation (4.086) above the mean, 68.972.
STEP 2: Divide by the population standard deviation.
We divide the difference by 4.086. Here are those steps in the context of the formula:
Transforming z Scores into Raw Scores
134
If we already know a z score, then we can reverse the calculations to determine the raw score. The formula is the same; we just plug in all the numbers instead of the X, then solve algebraically. Let’s try it with the height example.
EXAMPLE 6.7
The population mean is 64.886, with a standard deviation of 4.086. So, if you have a z score of 1.79, what is your height?
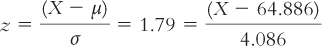
If we solve for X, we get 72.20. For those who prefer to minimize the use of algebra, we can do the algebra on the equation itself to derive a formula that gets the raw score directly. The formula is derived by multiplying both sides of the equation by σ, then adding μ to both sides of the equation. This isolates the X, as follows:
X = z(σ) +μ
So, there are two steps to converting a z score to a raw score:
MASTERING THE FORMULA
6-
X = z(σ) +μ.
We multiply the z score by the population standard deviation, then add the population mean.
STEP 1: Multiply the z score by the population standard deviation.
STEP 2: Add the population mean to this product.
Let’s try the same problem using this formula.
STEP 1: Multiply the z score by the population standard deviation.
Multiply the z score, 1.79, by the population standard deviation, 4.086.
STEP 2: Add the population mean to this product.
Add the population mean, 64.886, to this product. Here are those steps in the context of the formula:
X = 1.79(4.086) +64.886 = 72.20
Regardless of whether we use the original formula or the direct formula, the height is 72.20 inches. As always, think about whether the answer seems accurate. In this case, the answer does make sense because the height is above the mean and the z score is positive.
EXAMPLE 6.8
What if your z score is −0.44?
STEP 1: Multiply the z score by the population standard deviation.
Multiply the z score, −0.44, by the population standard deviation, 4.086.
135
STEP 2: Add the population mean to this product.
Add the population mean, 64.886, to this product. Here are those steps in the context of the formula:
X = −0.44(4.086) +64.886 = 63.09
Your height is 63.09 inches. Don’t forget the negative sign when doing this calculation.
As long as we know the mean and standard deviation of the population, we can do two things: (1) calculate the raw score from its z score, and (2) calculate the z score from its raw score.
Now that you understand z scores, let’s question the saying that “you can’t compare apples and oranges.” We can take any apple from a normal distribution of apples, find its z score using the mean and standard deviation for the distribution of apples, convert the z score to a percentile, and discover that a particular apple is, say, larger than 85% of all apples. Similarly, we can take any orange from a normal distribution of oranges, find its z score using the mean and standard deviation for the distribution of oranges, convert the z score to a percentile, and discover that this particular orange is, say, larger than 97% of all oranges. The orange (with respect to other oranges) is bigger than the apple (with respect to other apples), and yes, that is an honest comparison. With standardization, we can compare anything, each relative to its own group.

The z distribution is a normal distribution of standardized scores.
The standard normal distribution is a normal distribution of z scores.
The normal curve also allows us to convert scores to percentiles because 100% of the population is represented under the bell-
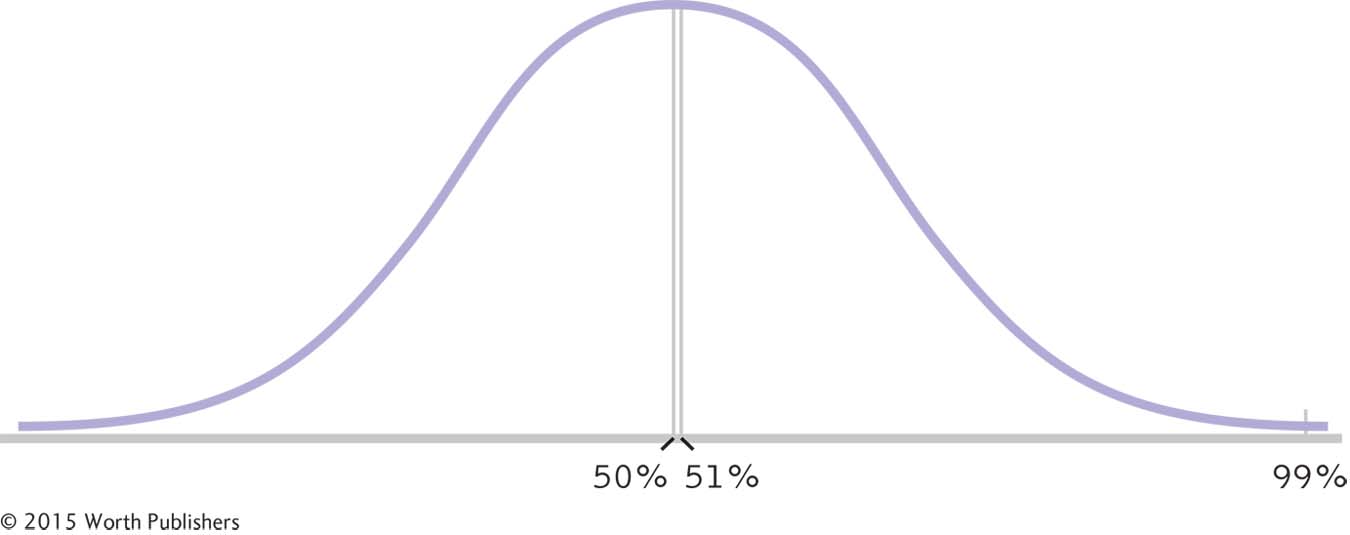
Most people are not content merely with knowing whether their own score is above or below the average score. After all, there is likely a big difference between scoring at the 51st percentile and scoring at the 99th percentile in height, as shown in Figure 6-7. The standardized z distribution allows us to do the following:
The All-
The z distribution theoretically includes all possible scores, so when it’s based on a normal distribution, we know that 50% of the scores are above the mean and 50% are below the mean. But the 51st percentile and the 99th percentile are still far from each other, so two people making a comparison usually want more precise information than whether or not they are above average.
Transform raw scores into standardized scores called z scores
Transform z scores back into raw scores
136
Compare z scores to each other—
even when the underlying raw scores are measured on different scales Transform z scores into percentiles that are more easily understood
Using z Scores to Make Comparisons
In Figure 6-8, you’ll find an example of how researchers use z scores as a standardization tool. Using the Google Books tool, researchers recorded the numbers of times that different emotion-
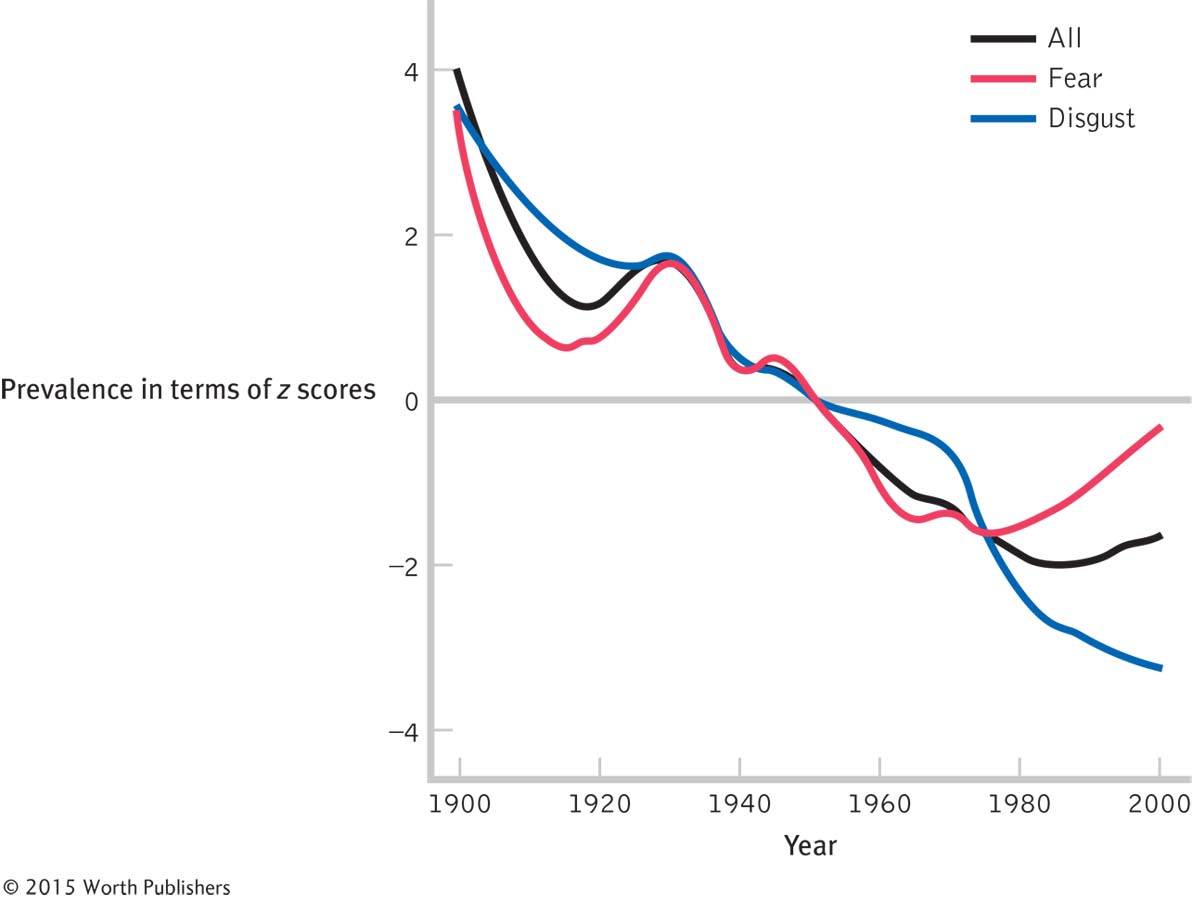
Using z Scores as a Standardization Tool in Research
Acerbi, Lampos, Garnett, and Bentley (2013) used Google Ngram to look at patterns in the use of emotion-
Now let’s look at an example you may have encountered in your own life. Imagine that a friend is taking a course in statistics at the same time that you are, but with a different professor. Each professor has a different grading scheme, so each class produces a different distribution of scores. Thanks to standardization, we can convert each raw score to a z score and compare raw scores from different distributions.
EXAMPLE 6.9
137

For example, let’s say that you both took a quiz. You earned 92 out of 100; the distribution of your class had a mean of 78.1 and a standard deviation of 12.2. Your friend earned 8.1 out of 10; the distribution of his class had a mean of 6.8 with a standard deviation of 0.74. Again, we’re only interested in the classes that took the test, so these are populations. Who did better?
We standardize the scores in terms of their respective distributions.
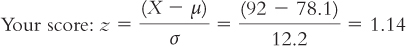

First, let’s check our work. Do these answers make sense? Yes—
Transforming z Scores into Percentiles
So z scores are useful because:
z scores give us a sense of where a score falls in relation to the mean of its population (in terms of the standard deviation of its population).
MASTERING THE CONCEPT
6-
3: z scores tell us how far a score is from a population mean in terms of the population standard deviation. Because of this characteristic, we can compare z scores to each other, even when the raw scores are from different distributions. We can then go a step further by converting z scores into percentiles and comparing percentiles to each other. z scores allow us to compare scores from different distributions.
Yet we can be even more specific about where a score falls. An additional and particularly helpful use of z scores is that they also have this property:
z scores can be transformed into percentiles.
Because the shape of a normal curve is standard, we automatically know something about the percentage of any particular area under the curve. Think of the normal curve and the horizontal line below it as forming a shape. (In fact, it is a shape; it’s essentially a frequency polygon.) Like any shape, the area below the normal curve can be measured. We can quantify the space below a normal curve in terms of percentages.
Remember that the normal curve is, by definition, symmetric. This means that exactly 50% of scores fall below the mean and 50% fall above the mean. But Figure 6-9 demonstrates that we can be even more specific. Approximately 34% of scores fall between the mean and a z score of 1.0; and because of symmetry, 34% of scores also fall between the mean and a z score of −1.0. We also know that approximately 14% of scores fall between the z scores of 1.0 and 2.0, and 14% of scores fall between the z scores of −1.0 and −2.0. Finally, we know that approximately 2% of scores fall between the z scores of 2.0 and 3.0, and 2% of scores fall between the z scores of −2.0 and −3.0.
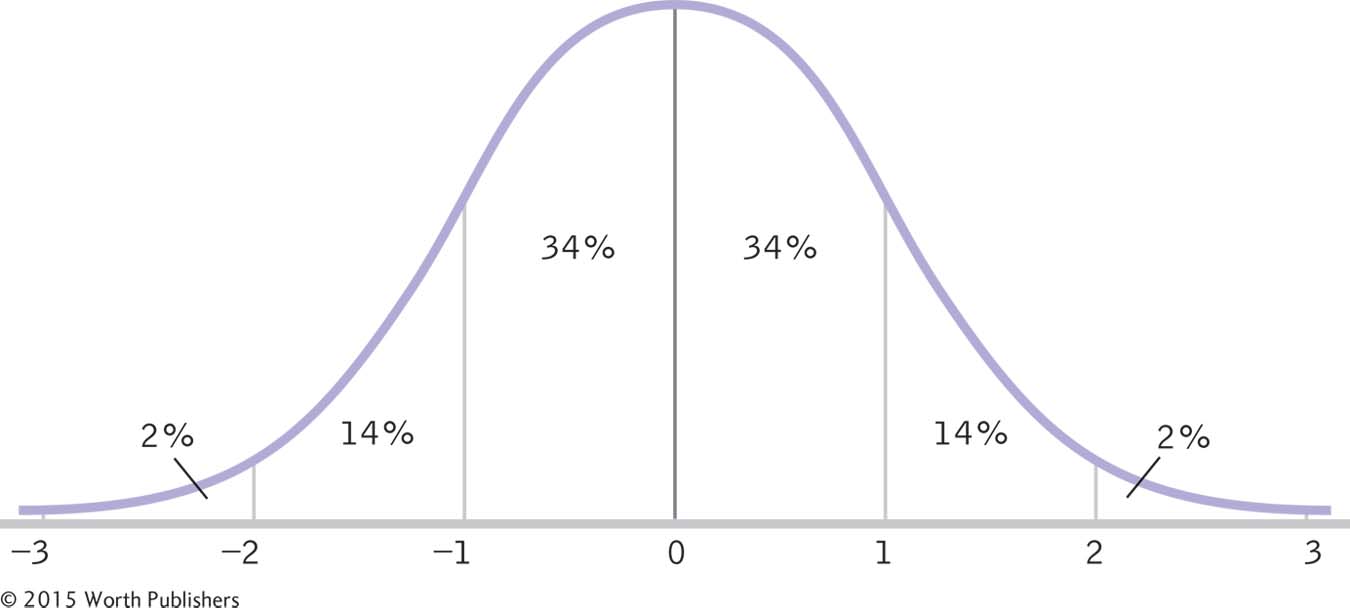
The Normal Curve and Percentages
The standard shape of the normal curve allows us to know the approximate percentages under different parts of the curve. For example, about 34% of scores fall between the mean and a z score of 1.0.
By simple addition, we can determine that approximately 68% (34 + 34 = 68) of scores fall within 1 standard deviation—
138
If you know that you are about 1 standard deviation below the mean, you know that you are in the lower 50% of scores and that 34% of scores fall between your score and the mean. By subtracting, you can calculate that 50 − 34 = 16% of scores fall below yours. Your score corresponds to approximately the 16th percentile. Scores on standardized tests are often expressed as percentiles.
For now, it’s important to understand that the z distribution forms a normal curve with a unimodal, symmetric shape. Because the shape is known and 100% of the population falls beneath the normal curve, we can determine the percentage of any area under the normal curve.
CHECK YOUR LEARNING
| Reviewing the Concepts |
|
|
| Clarifying the Concepts | 6- |
Describe the process of standardization. |
| 6- |
What do the numeric value and the sign (negative or positive) of a z score indicate? | |
| Calculating the Statistics | 6- |
The mean of a population is 14 and the standard deviation is 2.5. Using the formula, calculate z scores for the following raw scores:
|
| 6- |
Using the same population parameters as in Check Your Learning 6-
|
|
| Applying the Concepts | 6- |
The Consideration of Future Consequences (CFC) scale assesses the degree to which students are future oriented. Researchers believe that a high CFC score is a positive indicator of a student’s career potential. One study found a mean CFC score of 3.20, with a standard deviation of 0.70, for the 800 students in the sample (Adams, 2012).
|
| 6- |
Samantha has high blood pressure but exercises; she has a wellness score of 84 on a scale with a mean of 93 and a standard deviation of 4.5 (a higher score indicates better health). Nicole is of normal weight but has high cholesterol; she has a wellness score of 332 on a scale with a mean of 312 and a standard deviation of 20.
|
Solutions to these Check Your Learning questions can be found in Appendix D.