How It Works
7.1 TRANSITIONING FROM RAW SCORES TO z SCORES AND PERCENTILES
Physician assistants (PAs) are increasingly central to the health care system in many countries. Students who graduated from U.S. PA programs reported their income (American Academy of Physician Assistants, 2005). The incomes of those working in emergency medicine had a mean of $76,553, a standard deviation of $14,001, and a median of $74,044. The incomes of those working in family/general medicine had a mean of $63,521, a standard deviation of $11,554, and a median of $62,935. How can we compare the income of Gabrielle, who earns $75,500 a year in emergency medicine, with that of Colin, who earns $64,300 a year in family/general medicine?
The z distribution should only be used with individual scores if the distribution is approximately normal, as seems to be the case here. For both distributions of incomes, the medians are relatively close to the means of their own distributions, suggesting that the distributions are not skewed. Additionally, the standard deviations are not large compared to the size of the respective means, which suggests that outliers are not inflating the standard deviation, which would indicate skew.
From the information we have, we can calculate Gabrielle’s z score and her percentile on income—
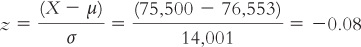
The z table tells us that 3.19% of people fall between Gabrielle’s income and the mean. Because her score is below the mean, we calculate 50% – 3.19% = 46.81%. Gabrielle’s income is in the 46.81st percentile for PAs working in emergency medicine.
Colin’s z score is:
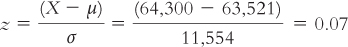
The z table tells us that 2.79% of people fall between Colin’s income and the mean. Because his score is above the mean, we calculate 50% + 2.79% = 52.79%. Colin’s income is in the 52.79th percentile for PAs working in general medicine.
Relative to those in their chosen fields, Colin is doing better financially than Gabrielle. Colin’s z score of 0.07, which is above the mean for general medicine PAs, is greater than Gabrielle’s z score of 20.08, which is below the mean for emergency medicine PAs. Similarly, Colin’s income is at about the 53rd percentile, whereas Gabrielle’s income is at about the 47th percentile.
7.2 CONDUCTING A z TEST
7.2 CONDUCTING A z TEST
Summary data from the Consideration of Future Consequences (CFC) scale found a mean CFC score of 3.20 with a standard deviation of 0.70 for a large sample (Adams, 2012). (For the sake of this example, let’s assume that this sample comprises the entire population of interest.) You wonder whether students who joined a career discussion group might have different CFC scores compared with those of the population. Forty-
Step 1: Population 1: All students who participated in career discussion groups. Population 2: All students who did not participate in career discussion groups.
The comparison distribution will be a distribution of means. The hypothesis test will be a z test because we have only one sample and we know the population mean and standard deviation. This study meets two of the three assumptions but does not seem to meet the third. The dependent variable is on a scale measure. In addition, there are more than 30 participants in the sample, indicating that the comparison distribution will be normal. The data were not randomly selected, however, so we must be cautious when generalizing.
178
Step 2: Null hypothesis: Students who participated in career discussion groups had the same mean CFC scores as students who did not participate: H0: μ1 = μ2. Research hypothesis: Students who participated in career discussion groups had mean CFC scores that differed from those of students who did not participate: H1: μ1 ≠ μ2.
Step 3: 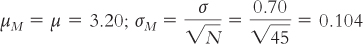
Step 4: The critical z statistics are –1.96 and 1.96.
Step 5: 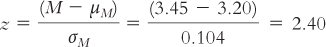
Step 6: Reject the null hypothesis. It appears that students who participate in career discussions have higher mean CFC scores than do students who do not participate.