9.5 SPSS®
Let’s conduct a single-sample t test using the data on number of counseling sessions attended that we tested earlier in this chapter. The five scores were: 6, 6, 12, 7, and 8.
Language Alert: The SPSS program uses an uppercase T rather than the lowercase, italicized t that you will use to report your results.
Select Analyze → Compare Means → One-Sample T Test. Highlight the dependent variable (sessions) and click the arrow in the center to choose it. Type the population mean to which we’re comparing the sample, 4.6, next to “Test Value,” and click “OK.” If you conduct this test using SPSS, you’ll notice that the t statistic, 2.874, is almost identical to the one we calculated earlier, 2.873. The difference is due solely to rounding decisions. You’ll also notice that the confidence interval is different from the one we calculated. This is an interval around the difference between the two means, rather than around the mean of the sample. The p value is under “Sig (2-tailed).” The p value of .045 is less than the chosen p level of .05, an indication that this is a statistically significant finding.
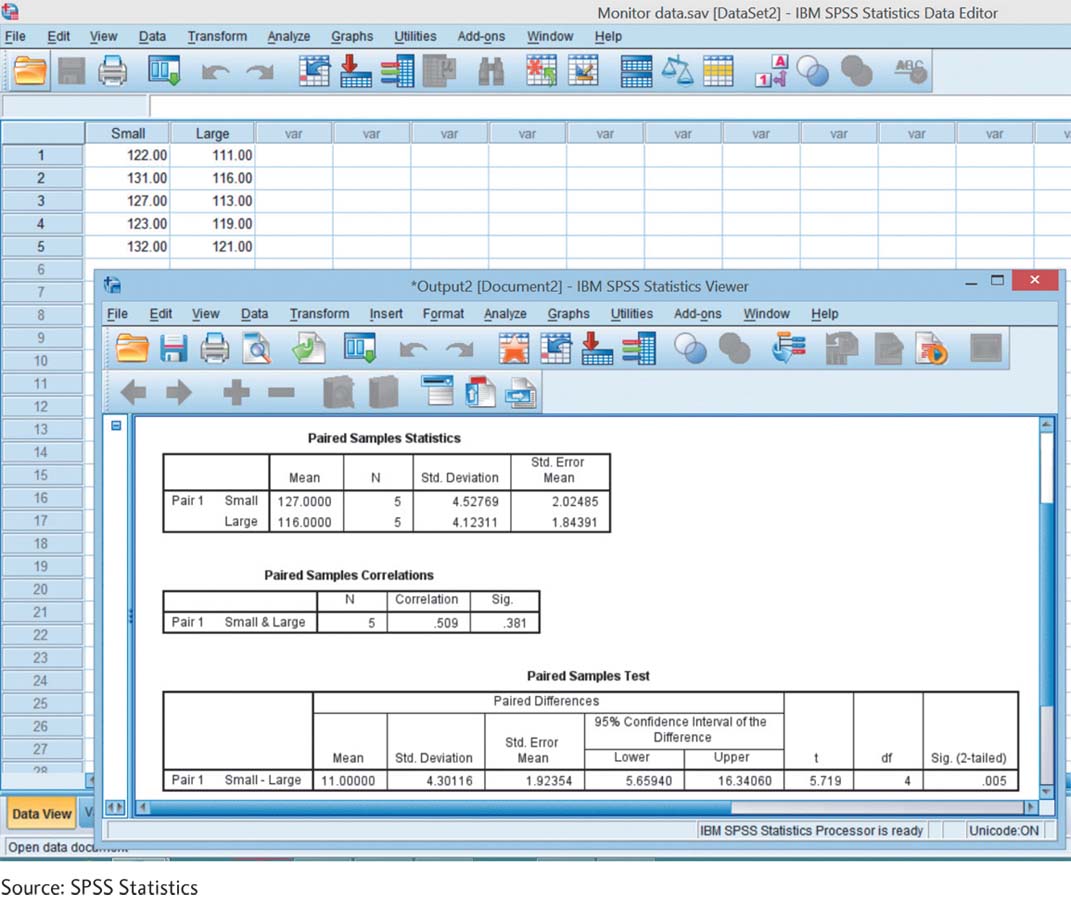
Now let’s conduct a paired-samples t test based on the data from this chapter on performance using a small monitor versus a large monitor. Enter the data in two columns, with each participant having one score in the first column for his or her performance on the small monitor and one score in the second column for his or her performance on the large monitor.
Select Analyze → Compare Means → Paired-Samples T Test. Choose the dependent variable under the first condition (small) by clicking it, then clicking the center arrow. Choose the dependent variable under the second condition (large) by clicking it, then clicking the center arrow. “Small” will now appear under the label “Variable 1,” and “Large” will now appear under the label “Variable 2.” Then click “OK.” The data and output are shown in the screenshot. Notice that the t statistic and confidence interval match ours (−5.72 and [−16.34, −5.66]) except that the signs are different. This occurs because of the order in which one score was subtracted from the other score—that is, whether the score on the large monitor was subtracted from the score on the small monitor, or vice versa. The outcome is the same in either case. The p value is under “Sig. (2-tailed)” and is .005.
Source: SPSS Statistics