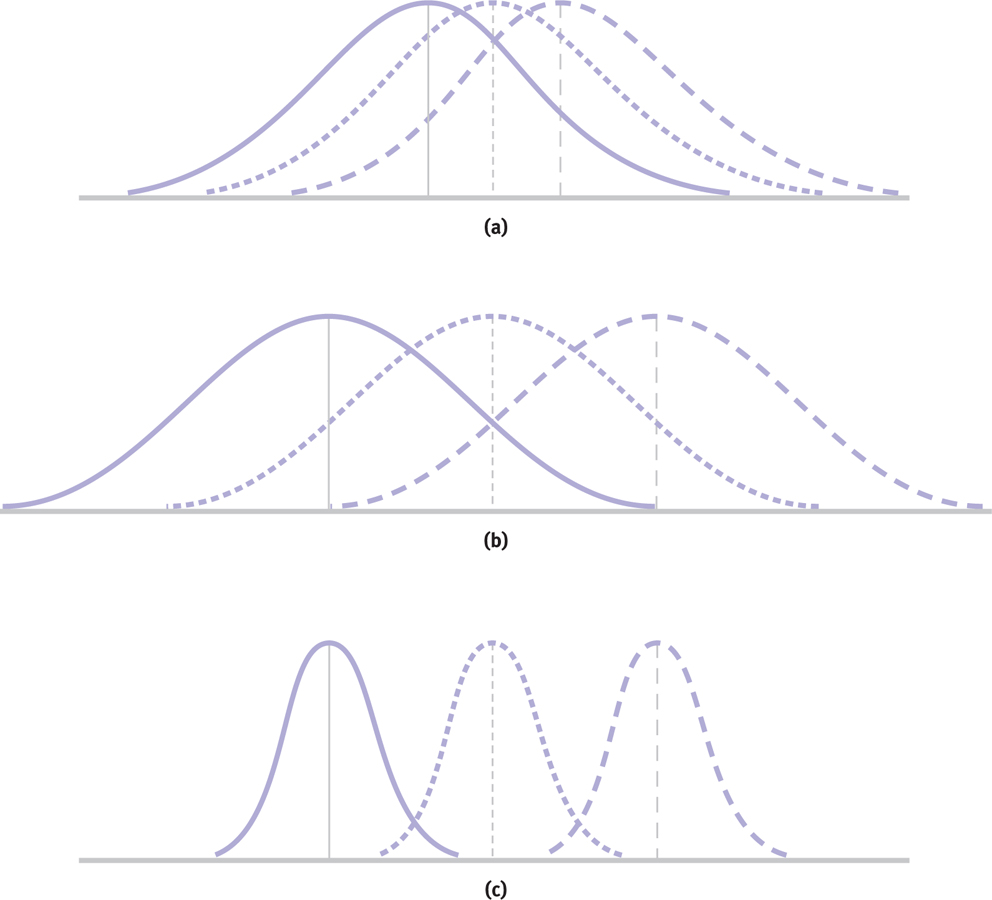
Figure 12-3
The Logic of ANOVA Compare the top (a) and middle (b) sets of sample distributions. As the variability between means increases, the F statistic becomes larger. Compare the middle (b) and bottom (c) sets of sample distributions. As the variability within the samples themselves decreases, the F statistic becomes larger. The F statistic becomes larger as the curves overlap less. Both the increased spread among the sample means and the decreased spread within each sample contribute to this increase in the F statistic.