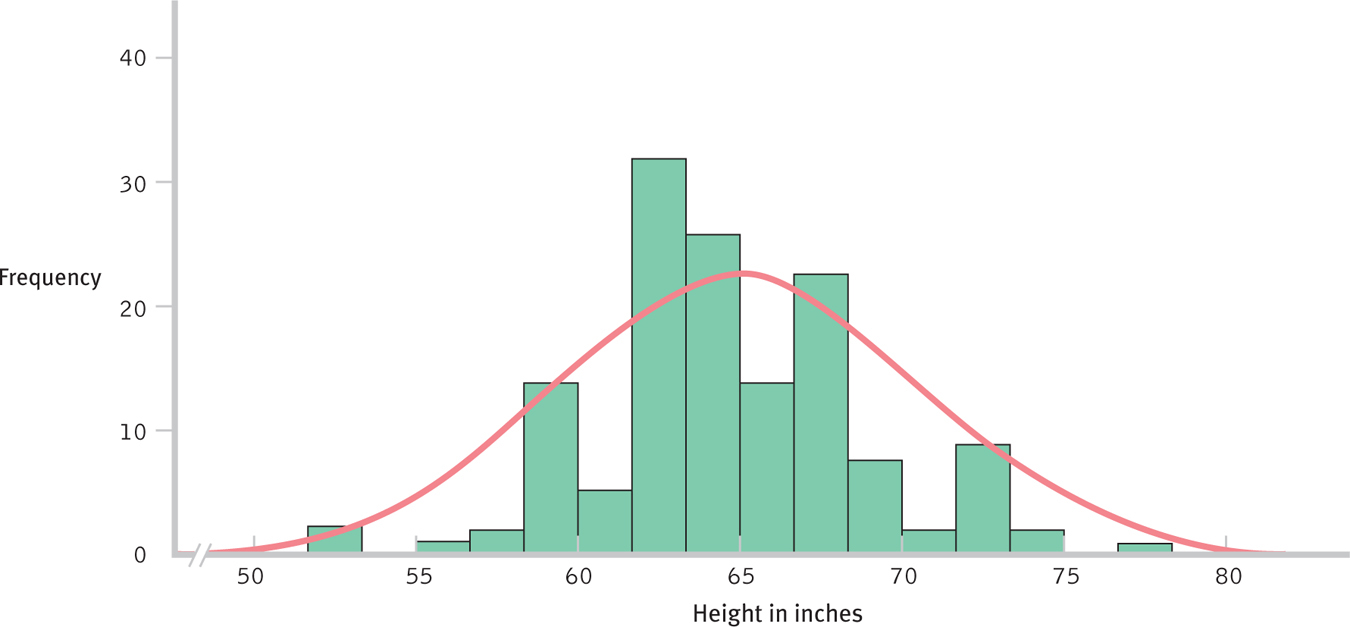
Figure 6-4
Sample of 140 Here is a histogram of the heights in inches of 140 students. As the sample increases, the shape of the distribution becomes more and more like the normal curve we would see for an entire population. Imagine the distribution of the data for a sample of 1000 students or of 1 million.