Chapter 12
One-Way Between-Groups ANOVA
Using the F Distributions with Three or More Samples
- Type I Errors When Making Three or More Comparisons
- The F Statistic as an Expansion of the z and t Statistics
- The F Distributions for Analyzing Variability to Compare Means
- The F Table
- The Language and Assumptions for ANOVA
One-Way Between-Groups ANOVA
- Everything About ANOVA but the Calculations
- The Logic and Calculations of the F Statistic
- Making a Decision
Beyond Hypothesis Testing for the One-Way Between-Groups ANOVA
- R2, the Effect Size for ANOVA
- Post Hoc Tests
- Tukey HSD
Next Steps: The Bonferroni Test
BEFORE YOU GO ON
- You should understand the z distribution and the t distributions. You should also be able to differentiate among distributions of scores (Chapter 6), means (Chapter 6), mean differences (Chapter 10), and differences between means (Chapter 11).
- You should know the six steps of hypothesis testing (Chapter 7).
- You should understand what variance is (Chapter 4).
- You should be able to differentiate between between-groups designs and within-groups designs (Chapter 1).
- You should understand the concept of effect size (Chapter 8).
In 1986, California created a task force to promote self-esteem in schoolchildren, hoping that building their self-esteem might reduce social problems such as drug abuse and teenage pregnancy. The plan seemed to make sense. People with high self-esteem are more satisfied with their lives, experience more positive feelings, and are less likely to be anxious or depressed (Myers & Diener, 1995; Twenge & Campbell, 2001). Experiments, however, revealed a dark side to building self-esteem.
In one experiment, researchers (Forsyth, Lawrence, Burnette, & Baumeister, 2007) randomly assigned university students who had earned D’s and F’s on their midterm exam to one of three groups. They received regular emails that provided them with (1) review questions (the control group); (2) review questions plus self-esteem-bolstering messages; or (3) review questions plus encouragement to take responsibility for their learning (see Noel, Forsyth, & Kelley, 1987). Three separate experiments could have been conducted, but a one-way analysis of variance (ANOVA) was a more efficient approach, focusing attention on the most important finding (Figure 12-1): Building self-esteem lowered test scores. In this study, building self-esteem was an intervention that backfired!
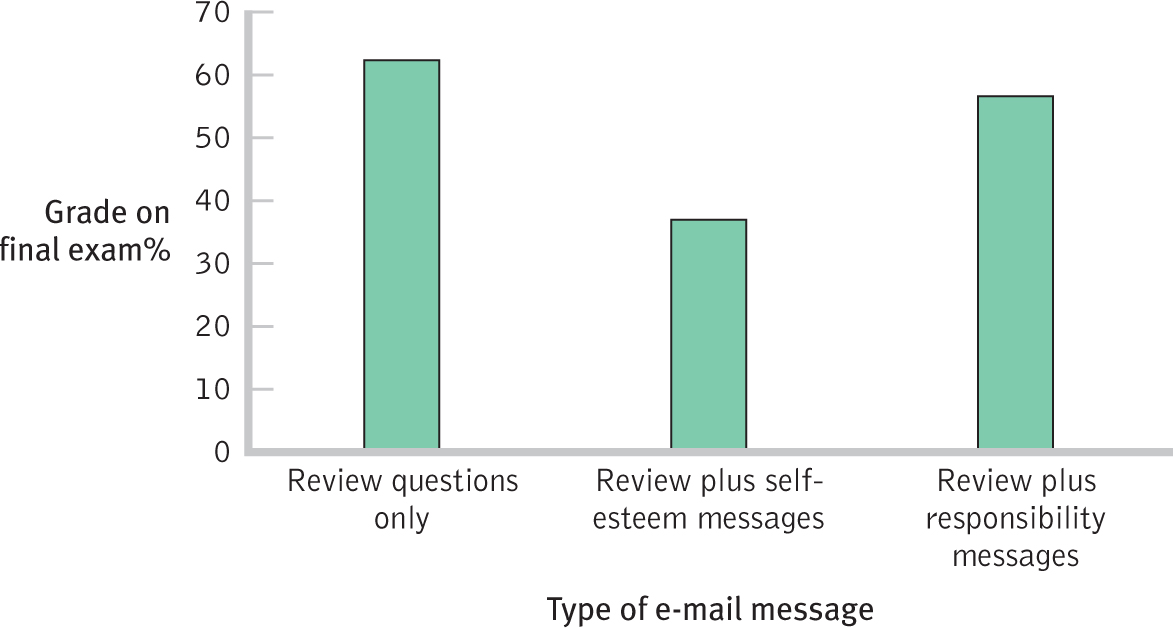
Figure 12-1
Comparing Three Groups Researchers compared three groups in this one study, which allowed them to discover that a self-esteem intervention can backfire. The main reason we use ANOVA is to compare three or more groups in a single study.
For researchers, a three-group ANOVA is a bargain: three experiments for the price of one! In this chapter, we will learn about (a) the distributions used with ANOVA (the F distributions); (b) how to conduct an ANOVA when we have a between-groups design; (c) the effect-size statistic used with between-groups ANOVA; and (d) how to conduct a post hoc (or follow-up) test to determine exactly which groups are different from one another.