Chapter 12 Exercises
Clarifying the Concepts
Question 12.1
93rkkzCIsTNf4JJe5s/j1yiuhtsCW27dY6JlsZ2fJJDadW6+Question 12.2
vxBvvdbDvDw5IT/W92Nrz7m4mwXsuSlubdxlR0MDwVX4E3nCtwNVmLQVYuEA/9MHMNE8GGMMJZdjYj8dYi+tmady9Sx/E/wGNd2iDx4xCTVudq3XCkZz1Nu0AFK+YWkY57qy4KMoTtsvhh8pZERuUw==Question 12.3
h5XhN02x1Npxj6cS//TntbiDvOx1t8gY75IWxdpsMylit+eelDaKx1JR/UghE0oZu1vXv5VRkbHyOVUvgfFwMK4YUzuIF+/wzZ5c62codx1zenCYRyt5bSRrgjEB1Q9F+frIlVDsd3u5C6t39+Ujld/b6q1LaK8ykfFhCWELqz5liYhv97DzvPwSYn2P1kGHaqmlho/NxEG9Jv/0owACMlhhToDj/5T9JiKw3ErNhwOSsz6blKxgWtXQaMil5UshD2RibDtPdpgbucJOLb30J52lERrjBElEp8ynQ34dhQqaLh1qscwkiBQrJBAKVcAHQuestion 12.4
HejIW1JkMgMB28ntjhy8TE/SCVykCeyVFIgXTmbWCU5HPhVR4p9SD4Mm4bJBQFhP1Nvr2h5Tg2neOg9bcGwzL+6Ayzl1ipW2TYJLiKQQlyhoycFiRA6izkdr+5u8hn+UCUSXJETKr1bULsgDfNaYyYomJ+t84hA1Kbvoq1d6zWHlv4RmLbGkjXJZFgtJ/kco73IJHoiRNv67gVn48hhk31tkFelcoOYobwsMLmIxwm1bu8NhHZAAm0Oqm+7FFDtAw9pYYRL4E6bATmMEIr/qi9TV1IV16TUisVb5F6pHT5SQXa2uj3f9pKPOpeJ/BQcdhEtw5jSdFXrsRasZh4zR6HsXAHA=Question 12.5
sRaAW1W5voZbUVLVUCTAsm411o6htskSf0qNoQlJ85XoixwGOQaJv1xLptEPhuC5qjLbNVza6MvpFMt5BxPkNbHFvQBWz4ogsAbuDygIbzXayi8Rg11Io7pNhBtsY3Q4yGORVBvM19l2zjMVrfyCd7SRiSu7J2vZsJC1gA==Question 12.6
Wpi3Pnh32/CabX3EBUmRBlvXo8bN2MU5lwLJlZk6p89R2A0q50OG6LJC9xZ69Uu4koT1Tv45Bq9XDtNe7xxXCO75YiJHP8UXZWb/7N7LC/M+7NpIKrPtVUgjYXrl3wW2aubtUucYltojsfHNKm3YXUwXoo9+FwD0ucTrO/pgTFHxLJvEUx3Xn7Yt4xlydeDK1sCNtRxfZirA982nBhRMM7bTsh4GKfmENuDoqlgkAGsSGsbfkW4IvqfswG8=Question 12.7
U4NQZu98ye7GmQoerMJ5ZJ3YI2ertLnqtW6h1EbxThoMfceLw+d+C3nafnD45dEBqEqtow05s6Ta0sP2in1K+Q==Question 12.8
Mzhloxq03hH+ezzwxWpgtIhY30+l8duqr+ubkujOo83cq4M4udj/ZlNZJ4hGOVrc41mAmYBCzbldlsMn7iDq6PnCAdb1n304P/MLXjnP17PEkjY9feFzaXvPEqkOlA/iVJ2/tN0vnekkoRyCNlmjfzlRkggHkiTqc80KMob4C69ZRKVo7k8cTUkFq/AIbN4FNOAzcdkoQ33ljwB5Ow+ZlAD7nFH5rgct4L9I5xLr93NQEFU9YdZQJSNuO4fChz4Lcnb6s3VNLXqkIqNjXU/q9wbZO/6J8dgZxW4TQpkJvppgmWgSQuestion 12.9
5i3Q6T4snkY1bS8s19oNWK5bPk/7PR79EK5gn7DODqkXLX/Tkhitxzflg8hJraTefWnjLhdom3DfDcPLKHv04Q==Question 12.10
3OszKjp9HErsL8Ixr24qkFeo3DbcHtDGiCCOwUpA4Qhn6a1sMhk6R9HXH7JGmOTvQ8yr4W7w4KQrjCLMPV0cKpjFnrAaxbjJ1diITqMlBOVgPvpfy6F6ahokq9muL1fymK5bBU6rZBoHv8qaHZH13vA2dgE4ZmAW5ksQNMNi0ektbTJdmK1xXPZnMOXbBr83HciJOVMMNbC1Kw65Ho1ipgK8EJNfbRFudCW5N4CtSxiibfCoFuQETnST+WjzZqPgGHIPLY6NLOZpX1mVzYQd5P5/ZRw9OJmnlU3pcQ==Question 12.11
WPuhfLDezJlZLHVLVAj8VtrqSBBTUalqaCp+p0eqjE/ZEfuac8a0eA==Question 12.12
JFRTZRfbj7RzY5sG9GeaChOpJ5vrvM/+7TgGti2t+ut5XY42jqJqnE+mOhO++J43+Oltkpe2Ujv+FbUid7l68ztEeuDOZOlJuT9lq/tyuDSzEycs5Y5/28DLLhf7fzvOhKt/eLmnAWb2rJmYTg7+BDzaViQsWYBpQuestion 12.13
Hw/KOASliIbbpRk1AzzveziQw/rMPJSfUMHxMa3xktXAzy4PFAdBOjhisS2XN5rz/8heYTGQvJYqrG9MvZmPhjDym/RAOCAtOeA1hqVU15N2N6edJ6Ch9XSpI6Dex5rcmPLRXwemg7+1hy4ETea+reanDelbgOyC5uypvs4fQ2ah0tN6llMmSqib5cHSYkC6Sn1qqa+zDNDbPn5xBzxxGQ==Question 12.14
H+PfIHz8yh9yrHGwLHhQUSzX2dTXhkITQjs7GBuqZMFjKH+dUMQm7RVGQh91stxhLAZzhrXIg7FTaikn268lzzuhOt1/1e9CBmYpcj2s6v7O0+Dd+QbGK6yCaTX1zrGfF+1GAT9vpJFuwbr3Question 12.15
+6uNILJ6hXdGJ+tlMz49oOCHxwmqP5Y8jAWLkl9Pb8cNNCehoax9Wj9kG5J6GdJQb1Sg6CL5woDTbnWZkn0NKoD6LIMehwxtSPOWy3I6Ixaozb6iobhjMUe1L6AIKCIlQuestion 12.16
YtilVmt3EJ0AYCfuwa5/HkNNSUZ+9ytdsXP/N4tWlu0CrHweOnMuDSymlnWQH3XOH3c974hG/l5htf/Q2u/bCUCsO/Uw8SeXe1sbBEObR/GH8dich0HJdcxEyGGKDDrNAhWPfKEX5c4TbK2KwI+hnCDVTroa+g4i//aZNYal+Of8XpefPU6vADIt7pRBgDzSk6Okq/Tfi4j3rcbS+dLWggJfsvZBYg3igRUgIBNAwCJ8c9z/SnXXOp3s/KAu/TnprggT2A==Question 12.17
Find the error in the statistics language in each of the following statements about z, t, or F distributions or their related tests. Explain why it is incorrect and provide the correct word.
- tMueti+9I+j2Y6n8dhl1NPYhp+/Jmib3f4I0QPpwkkGuxC6a011q3v1I6IM6eyVRxkmffwm4jgfs2dmIE7NJODunMoZcc93Vevtc0DiuVE8+PmZKTsf48x+1edXKCiGSWui7DA5+aUrGP3tSZ9Lz1w==
- NkBXv2JqeBI3MH2gvmYhvvLCYbSD7R45XG0LqkIOTHfA77qz+kOsFZnrhkCiKVVjYCvUw1S5S9TlEMWRHJq/p4ClPmoEoggd64ek4ynk7OH52XxcJAA9ofm1ADsaPvQLKufgHufDgI1YouXHQd+eBxHu5wsPtpHG0N8xFg+Of8HjLunY29mBFA==
- S9AzpQ1jdmDelcpBpRxF3wj2hx060+yPUMcbL9RKpuB957Rm6jBluRbcljTZsBQGSiTiVDVM4k9qNMI2OJOXnaq9U/ac6qWlMUL1vlHB4r8q5NkY0H5UJExI0AQphlyHQTgxwU8L5oo5tJKqvVNNClyBDRbPj2oMmAbf0azQ1mRRVFi3liOlEmLUALIy9mQtP41qrWZdDn4=
- d+vXrYXzzbQXk9UCCq6JbkwHMJY+M8qd5llcCFz+GmuJhPVpUlWGiyLzX/4e06mxW0ougYU14xi1+3eKrgDclsyoyxN+IoWT4lwt7NwbilEA5CouN91peJF1X0QTRVbkayEi8JjYdQuoon3LFVS0PIatTktEBypPStvVNophe3Fq6yLETPJCULRLLmdFXTQy6v28OTVg0qLpGpB8tbBukgUU+8iK4/e/S6IMUxFUvsUCS7HKiWVt8YyZn0txgxPnrw4g5XPUqGXrGKzMAg5YI3ZH9+A8aCdpS48HoEUyF0VgBDqedagE2O1lYk3izW8/GtWxnmstXk/w5UuV
Question 12.18
Find the incorrectly used symbol or symbols in each of the following statements or formulas. For each statement or formula, (i) state which symbol(s) is/are used incorrectly, (ii) explain why the symbol(s) in the original statement is/are incorrect, and (iii) state what symbol(s) should be used.
- 9jZ03VF0oNXas9AiMiJ4FfPAF4lKAGOqlOek64rMyvNYb33JrJ+Cql3sxjT4vso/2uZ7KNWQ277DaK/pduGwOQmmq01GnXwyPHXT1PmkqCWFZyZsu66Bqn3Y2KxI4AgSsvVik75znPfqCR64WMD9Hwg+G3G7q5Iky0/4PLAMlNZEDVJSbId5djflxMmg8zVWHb1uuQsFV8ScpLwWB1vq6LQ2b3rcSLVbSe51252g/gxbSkJuzebGMl0ODCE=
- vLLqAOrZKzjiwAJSAdI5AQ1KYqCCTQGqBomNJRbIeRhwBKog3BBhIevjCFFmAWqUE4SX130rP09B3jGH4y+dUaYz6KM+WM5jTTaUSIAIHDZQu9w6BEblkw==
- lcxcXfL80v5OhnVi/PeLlHtcbvuNDeoV3ceTtXtdQTeOOUiyBhU+Lzze+lLBMJy/AS0hIDgyddxKzy1tyC32s367x6n1u1Wny9e9ww==
- FPPEDTKnLaNRHlpqYZ3MHrEGb4t2uhcN2uYkejZ+O/DFfCiVHa8hu2QNb6C+X/P7ZZoV5D+xAE5RFvvJB7dL48KrBjdqNxfGrXWQYr4kO76DZJml1ChOenMapMvffLfIGLL0GsPdQZdw6I0mRuk7dXRfGKuTS+ygtUGcLTyqYI63V8QY/cnoeowLnEHKvfory+OgTUXwsXXfLI1h
Question 12.19
q2n5/cinApEi9yVbP4D67vOz3uUDZhd0N9CwoP3rNeQITKJszuaLvj10xJ+EzZiusqOWyldpF1+65wyZBLY2ALbYqYPA0b6iQl4EF5FfwvbLy5R/BoFKfBacpbos2Ud/320
Calculating the Statistics
Question 12.20
For the following data, assuming a between-
Group 1: 11, 17, 22, 15
Group 2: 21, 15, 16
Group 3: 7, 8, 3, 10, 6, 4
Group 4: 13, 6, 17, 27, 20
- VLkW2TImDUA73kmyxcPj6BpEdxQAnyj5/WA0zrQxsiM10sLzF8v02CWB6vKqIFlm
- 6T1slj7M32n0qNlMHg9msHCmX7JRmchLvGiWucXMYkBDAKO/oFN4qvyPkzk=
- F+ZiZbqDXE3pP8J5POM2qMpEPWpVAplNWpM8vYmOLcCtwaa2u9KOOKhV9to=
- 1Us0uD30zfRNVV5OcjY0xSlpA0gSgFZCp1CUzGC6S2o6YWMkkrKzG26rhPcOLwtT8uy6uLAR2skC/ksee8MU4iGUpXLBGCmX
- vt6tJP/reYrc6GcQpmA4tf61jBZmWFutPebTS5kKxDg9Ys4X5XBXHLsL/m5o2sjjD6nKtqpzj1mul7e4
- wPBQscyTJ/iYVsRoY/y/chrNnCu0EsjKOEWHDbWV1bJnemKsTG80WA==
- QMOoNFX7uxLZ81Iuh8hQbQvUoIa6Dwou6DS01U3uE0vASuy//iq+G1EAUqWgLrRHNbF6aseKdksXsKTd3ZuBAonV6z1m0ZTsSQZnFcABlYPPvzxWBfWA+ddFq1JPlQp8
- WX+xZBLAThxybhINfLt6OFSGJoaSNAjyMp4drrKhlFuas6tFRNDV1Swih5cxlDS5HsyTpnYAA2ltFxwT9hS2HoFYbvaIW9waE4AABMu1f6aIiFwJSDWlG4AUsWtF7CYs
- jXPmUpVeLIxJhyYxzBRhLqq6TPzwYOhOzEuHhBIiZ/7iyERCZsyJyxfHHd+Cu1WRIhOv9GU6VPDE6QYjwAzH60d4zLk=
- gKwYpUxv8u36kMec4gMtAw2AUoB8NuUUicy/yx2KdBJ3jxznZ9NPsiYaVrg=
Question 12.21
For the following data, assuming a between-
1990: 45, 211, 158, 74
2000: 92, 128, 382
2010: 273, 396, 178, 248, 374
- VLkW2TImDUA73kmyxcPj6BpEdxQAnyj5/WA0zrQxsiM10sLzF8v02CWB6vKqIFlm
- 6T1slj7M32n0qNlMHg9msHCmX7JRmchLvGiWucXMYkBDAKO/oFN4qvyPkzk=
- F+ZiZbqDXE3pP8J5POM2qMpEPWpVAplNWpM8vYmOLcCtwaa2u9KOOKhV9to=
- 1Us0uD30zfRNVV5OcjY0xSlpA0gSgFZCp1CUzGC6S2o6YWMkkrKzG26rhPcOLwtT8uy6uLAR2skC/ksee8MU4iGUpXLBGCmX
- vt6tJP/reYrc6GcQpmA4tf61jBZmWFutPebTS5kKxDg9Ys4X5XBXHLsL/m5o2sjjD6nKtqpzj1mul7e4
- wPBQscyTJ/iYVsRoY/y/chrNnCu0EsjKOEWHDbWV1bJnemKsTG80WA==
- QMOoNFX7uxLZ81Iuh8hQbQvUoIa6Dwou6DS01U3uE0vASuy//iq+G1EAUqWgLrRHNbF6aseKdksXsKTd3ZuBAonV6z1m0ZTsSQZnFcABlYPPvzxWBfWA+ddFq1JPlQp8
- WX+xZBLAThxybhINfLt6OFSGJoaSNAjyMp4drrKhlFuas6tFRNDV1Swih5cxlDS5HsyTpnYAA2ltFxwT9hS2HoFYbvaIW9waE4AABMu1f6aIiFwJSDWlG4AUsWtF7CYs
- jXPmUpVeLIxJhyYxzBRhLqq6TPzwYOhOzEuHhBIiZ/7iyERCZsyJyxfHHd+Cu1WRIhOv9GU6VPDE6QYjwAzH60d4zLk=
- I1K6nm8BstG445hyGJ3II13VS08bTpNgbPeRkdpZGJ7yE7JeB4SppBLvUMyyc5YAGhAzjZR1r0sfdJ+SqJjNpA==
Question 12.22
Calculate the F statistic, writing the ratio accurately, for each of the following cases:
- /EYHmEFF31gTeBB4d+E86khWdoUjVZMQqySRVMp7WTCNOCho/XAxFmWlvDVLTz0DIugtlGQ8dKJ0NlxFJ0m6HOR7nDEuoyyeqVedx/7nUTdSGiIEVUrF4k37k44c5Q0ERD6wZW1TmjtzYvlFuvjzV28+cE64o31Ye3B8hFFSn93t8oh1xfrFXkoPFdPiSVCxwtdJFuzd86hLSyaJK7C3cEv09HnvQyxdeC97zdCqiOU=
- LSnt7Q9heyBEPnaGsEdpwOolZYBs7irrCItVfmDliVGLhhqnYQkhd3smBiYzzQ7ogCdZzHeasLBH1str6CLCnE3Yk5OJuIl9MXxylyr7vnt0ksubw8U89W8fs9RkcQqCbMC/+b8CAzRL63jVO0tZw8WJMzO4uG4ENHqrnGpu4IkBt2byFmEv7EdYRxecsDgHUUZ9iKODdYwCaAH5iAyWys4c0aSIfpaBB9nNQdzrZIQ=
- vSuCT6guCfOvpHo3QKKelSrvJaqjM+2DVqMTa5ELXuel9U4X7Oq5S0Z7XEMEGK9V2ZAZhMJRV/5fV8Ww5+0iz0zbi8e+0k2F0hfFI2T1PlH3NfR7hzqM32Elkxp5rMj4C/qm40Uum7zocJ7x7le8MK7j0auo4czlKRW6ZaR1/AJJgSSexTu9fy7bY/tcxw6wRDJ/bSu61guLmdKgvvtyqFzUUNFApxJRbeydfYlhlSc=
Question 12.23
Calculate the F statistic, writing the ratio accurately, for each of the following cases:
- SRINmJTzO6MlM7xoUI7YjhtpfoGLvctMTi5BXmsjJRrnHap4K1EmwpeIb/t6QVHyON8b+b1QNr11ufeme9mVWXckhjTcNPhKxYLz4rkK48CHXQMD2iSI87JUHcq5PsD2pyKV6iU7tA70JFvO5EKiM8uJeC+pXItfVhS5dY3CqFmD2xsCBleQF6yxZOxjYm2utwry/2xXXtbrWmtjSaBX3/ZSzqlOwUq9XQPD0OOsEGOsHi7L
- h6tJux8RS3vcTNdqeIyKmydWxVHx59orwNDGdanWzuYuZQzi1MtOi4x96kbGUnEO0tXaNjnmQkD486Mx926azfIHl2FvgwR4/5aBeKyO0iDAkbFG8dQXdRV2Er2bCoqMxHru6dE2KWA2oiWVPlubYLP7DSAxqkk37t4vxFJpHSYEJLJmUpEexDk+ow1NvAzd6/3VIXnjFnUYeffyK9fgFkaaUbWKVJjJJgnAlXiFqqs=
- z3K4aKkj+oXbA6OSxbcYqwQhLEnV5sXle/+212dgfBHEVLF77dC6OlXw5Z5h+rwJYpNT7s2HEfDow1+g24YzmwZ7XTxLswHxsJLu1iTFgRZ6yajPmZEUJHaP/EOyKtOVtuIsN9D+g0N4hqtw4rfLPbuxelj5T9ron4vGeaLf6WW+s5B7Ewmas8qFrXprd6/C9fds6GuaAeFkGfHw89I9LZnpS9ji3Spso8C0QD4DGiM4++Pg
Question 12.24
86ey60jN2S/NMO+kFzKWa04j15SwrECGOUGQSzFP46DAg4hkNDt2RyjzJcUf4G9wMoCZlONwG/u1d3nRDZouJHdI6NuolFHbCYM4DFJScRhW25hkmDwy9t4FeZpnceiKsbCD01LbaC6rsCwvY6+Ezv06pegYJCZG50gxreiBSCOSjyWZsppcUoqML/nc0SnZXtErGo6o4as5RwdkNHJ2SuTaS+3R37wv0+4lGiOLDqvlJ2WgxmMIRLklRTKasUEw6V83to+fFTjPMEmL9JIaug6koIY=| Source | SS | df | MS | F |
|---|---|---|---|---|
| Between | 191.450 | — | 47.863 | — |
| Within | 104.720 | 32 | — | |
| Total | — | 36 |
Question 12.25
86ey60jN2S/NMO+kFzKWa04j15SwrECGOUGQSzFP46DAg4hkNDt2RyjzJcUf4G9wMoCZlONwG/u1d3nRDZouJHdI6NuolFHbCYM4DFJScRhW25hkmDwy9t4FeZpnceiKsbCD01LbaC6rsCwvY6+Ezv06pegYJCZG50gxreiBSCOSjyWZsppcUoqML/nc0SnZXtErGo6o4as5RwdkNHJ2SuTaS+3R37wv0+4lGiOLDqvlJ2WgxmMIRLklRTKasUEw6V83to+fFTjPMEmL9JIaug6koIY=| Source | SS | df | MS | F |
|---|---|---|---|---|
| Between | — | 2 | — | — |
| Within | 89 | 11 | — | |
| Total | 132 | — |
Question 12.26
Each of the following is a calculated F statistic with its degrees of freedom. Using the F table, estimate the level of significance for each. You can do this by indicating whether its likelihood of occurring is greater than or less than a p level shown on the table.
- jpew7F1MmZdd7y12wjz+gjsjPTUcclFy8jLWOoWlrwECZjKD9GSf1ACqbN5kyZmqdh3AnLFicPzZV3WiNCxYCNeSTISUUSaGgqkx6ZBXCbTQZI3SbreE3dVn4Es6k1SnVuPpUeY4HwOv6kuQ
- OccWorUzbsG0c0VU6dqp4AbE2bbXzf8uwXstyx3lbX0oFMN39DAbEFD75pl7+owUf8HK7rJXBPNtMQyvYgeUClvBVbSKIOb+EKCkT48j7PL4U10oaBwn8E6vjioVJ3kxgiAy04AHYzMarghg
- Ml6PGVRT6Cu/U8dG2Ktm/FdYiJftq/tP4LN3171m6bpw5MXMH4QvCVn6X7Avhm+5fIsyFZaPips+pOWKi2XqN+m+c//qcQtESZ3QWxFwdI43VoB21fKSoaAZ7Ph7tljakA5+SyvYy4lD8cws
Question 12.27
qe4ZNRbfiZueoZNXdL7A9S6qeSuprf8wOzH7nFzbnl8O1jdJQzm2sL0uj/DoN5BLAo7u07dKT1De1qgc5ix1m4sybgN30HED6HEN7wh/hF9ZmQu2shRGvNA6X8PdAMp1BJ0R6qjPbbJNVOV8WIlG0mk1F9ybq73Llech0yJ+5BX4y7wr6iyM6rjiIom+xOY23/FQU0I+EbvRn43syy8Vcsnbma3OG9E0+P8jtXVX5kYa/O2pTSRGggdygLarGldXXpbuWm7G0koscot3uQmc1Vvxe2bCdt016eOFzY8hzBktyGYomjxMrbMPUlNAPdfHI7wOMFZHyC3YlSWF3LHjGpO/0ityP0NywbxsHWdYUMgKt2J0Question 12.28
e0eYXwCXCfKi9/eFcjFXl4DBwjdIUPEgc/+579jPR2qT6AB98rWrzgrw2s8JSCtxTlYMWTS8a/Vuc/A2pddOGRZGLoWY1O1+SYHvMBwVEmLMRo2WiJXOAlLcH54RdZoZ2BWNIgdFa/WnfhaKcUMXkmagvTXPgFAEkUc56+IfaH2mryvw3aqXgIPwlAQgKWtqWde97P3tnjkRx3KxI1gkunzY9YRSAzixbgrlvz5+0zBvSkQhFHwMX+LRwZGZECWOyhg3aMB/FGcNQHiKMRNQHGuJgO/Iclt36PBnD/1uVNAC12fmKL8eQlFbo6BSHXvycY+6jhqtq2ToUBS7gJIkdhWpruT/eanCxi8jzyMB7Ecw0eVJQuestion 12.29
wGRStNbQaMGIz5jMYNxh+ygNjSLLvLCg5H5IjEeiDAuggb+sWed5ua+K6L9KlNSg2GDLNf514LrNBAK/XsWYTAt6gLVJrNnmOwDFeps/MfeXJRONx6KFu6KHVlfmAzK8ulfixHN3U++Mc3196nuTrEOjBozveSCEc08JQm4K8MzmVrFsLTjjHGbI8nuzFFpFbJHKCJHjBcaDjaSJ+dMjRm4iDK7drV7IcTC/4jP2eKv0MQiQqHSLTYVa1Sg1mZEmzsHdw5GS7bIthoVuxLcIsd6YU+jyyQdbjcmQGDmeKHXGUYaw1tMOJ+QRScNn2CpP4Maw2JYtTGaoZ5jh2GL39T+joe5f98A0xZI+mdV17Iy0YKuTyhYW+A==Question 12.30
Consider the abbreviated version of the study by Irwin and colleagues (2004) that we analyzed in How It Works 12.1. Assume we decide to do Bonferroni post hoc comparisons rather than use Tukey’s HSD.
- 7ooyFPIVXgoBtXOjnJ9KIOQ79sRxQ4AjotuvTbn9/3u1v08i8yDkJ8hhdhw5QqucS66u7MOjpjpVSBP9ql60MUUj+JTxnnHnL+geCJhiJ/5kpmT4skXGIZQoQNn+j4O8fpy2oxRGALMM6Bs2UrkJbhT/Bfg9s80waDOAST0Puw65yH9nYboJv2n8/Dtef86pvoIDaZsCk7Y=
- QZjAirLa6IfyMnfRKphzKoq0h0Ta/gJnyFUdkxiR0/7lTevJoIjWG6+uivofezCz5pATRCjGZ9Ud2qg8Md46sqRdpZ8B/Mn2ohlAbcSCG6Yv1rir2hxjt3urzxR8fSZlZfzGiNHUYslSKekS09ZGMGVDGwspxhJeEq75lyx/+OW0B0MHfI/hrweJfxkrzSksglbyygB6ekg=
- GYd5TBxYHsdSPc3FZRNYNpuzkYwOJbMKFRo/ada08O8cIE8+D14Tg+Ke3Oq21vxg0LRx3e2e24q06AYRjd6UQv0PHBKmDoVnMl2SCEQkCQSPlOEBNMNa+Bi25sx0Xz174R/rWw01Jby1M7khavfKyhRT5GC3MPOnRoaOavFke5E/RLYxLrF1EtnF2kPdyBuDzdrj4R1gkhApy2rCAnqlPgS2Mp6h1FX63lDWfFeg0dtHIr6Hh/55IqSY45dqegB2MK4RKJFEZF03N2z88RfyEhP6IUh058WvQlzHpd+S+PoKDQxlRHLOQo64OpCVqZohh8kv8Rwj2XL6v4dtVjFb8ViHBvtyaZcP//8Ert5aPRHeDjbprvQFYkf4PwWbm2Ox4Qmv00GwIxWWglprPiWVvcH/uV2SBYN+jouGAZAKtHbbX8CKrbB96L3W6vEZP9pL3vuC42iWdqeowKY4gELvGxFStIVDaOWIJ03zWQzHUrKwARjfS34kQmKoqyxtgzA7BeTkr0DXyuNr/qukR3J223J9ORILwNjJKEbrUc2rXcBF1n5R7KpQYqsXlQ5Lv8LukJZTZUUHhFQMHKyQW5OVJkCWTH7KIownezLRVxJmdm8BHf6k/RV/RdAsPJlI0kvU8T56QN4cBLJHAgSxTecxj1HkJXZUbZly2g2/jmCmQbMShkk2iLz31bmSA3Nb+S9BzYiWgnfxL8aWqghfcEW9JMIaoeyQ6i5iDhLV30PKLPtBQfVDvBqAtk/TeFBsh1sHNnGo6QzwzF5et79sjqzS1oXW8AnfTVlhtS+7/qf+wRLN7sQfoadkHT2GAvCZCxS/lgqv/cvyb6uXD7MNxOyPs4yA6g0nr3hoIUWPo5Z2STx6Faa8sp76aMktGrm2I6bri7/3s8Tq9HusK+qYaSTkt2VClvewGRhccqoDBjy+S8UcfizdkFwyUyr+qExLTi3baHEs9Y31+I91eh+UPE4JNQjP+KPWYRsrHgj45o2QYl1MyWAa9Zegc/SMetWWE+3Fs4ywzC7IB68dCK8qL+1QSyuYVZAjY1iV4ImkZKRi4PErGdwjbxkWCRwVGD6FQhoFXJAWxt1XYOrgUqS9h8sDT539efuV7MnJ02DOP+APftVXCo4C3cakQSf4QuYOpxapvouKaY2viL1kCPSH1TaB4q+UTSNv1qTFMm8/W/5hF5EydsRaH5SfU5LEr8H21/93ArISyxMgKlazsaaO8Yki7u6/kJIQxDUbMcPTO2JaoHYfpbpdhleLGXInpjibC2mt
Applying the Concepts
Question 12.31
Comedy versus news and hypothesis testing: Focusing on coverage of the 2004 U.S. presidential election, Julia R. Fox, a telecommunications professor at Indiana University, wondered whether The Daily Show, despite its comedy format, was a valid source of news. She coded a number of half-
- 6S4SZEorB6PgRkEocHRiYBD7tux1iHHMJiG/QKO4QPHF61oEHp87PRr7+cYmqgNRBBiI579ETZhttpPST3DfqKFXjDD7YSJmVxk/vFS9Aq0sdwNFOL6l+roQDB/QQlWK6NYgOuysAqCIbb4OkoEMemLccG60eUNWyxynsmEa2LJAf3MUHnPE4A==
- +sW8oo7TgfHUQ1XMKpFBTYAhkGRc3lprNQQcDR8KgyZZ+J8lOkdWrzd3SqSwlxuJ9YlvhV53sz3B+JPBDwMt/bsD7DuM+ow/2WI4o8W5n1wtx0KzttH+cA==
- 5mEh58uEOSTf2xbq/NILKZXznQriHLNdz9+/VyYTq9KpN0uAsdPgt7IT82ceQCP0f8jFKbaqUZdX6ltKHpSrMtGoLT+SFQiFEkRt5qJKE77u/+IQhLkr/24EACVI+/DxLNOym9ArKpUntbmuaXulU7B55MCOB357ErrVRfBANzEBzcHrUxv/0Oc5ulIg6eDPA0CA1bHgOZDWvA26unE6Dkbrmhz/YKT8vbdVdRXLKSekwaokO6ui0J7s37vix8ZNGUYvIsKVhK4ZQtGx1r2L5ZJN3c2T8sFZfLqhrM0grAEKNwKk6x5T/fXRFlzea7lKnT0KEPA5Hbprlek/d7mwPqSWFws=
Question 12.32
The comparison distribution: For each of the following situations, state whether the distribution of interest is a z distribution, a t distribution, or an F distribution. Explain your answer.
- v5WxWOh3/qAutysKqnhyl3PHBNd1VdRg9VUAJv+27WwzEc3ABhQ0gpdOYogumUXCGvjyJiNVxbmGLT+RKuqC254x9Y54i/1S3RSfVr1wetlarCYZbPHUGEe2K+5ji9cvI6GvH/ZwGsTGG9b8pN2l4XLHYImt/wT9XcfVzc3oSWAe3sd0XtsNlYbYgR2EwfAGyPHSJQB7Ml4dRfPmsU8ftC32CCFaJf+koDsmKEEQbSt1U1m66izd2CuGAcHMlghx43v4v9YaIO4sDb/zzPPCuvgq/xDW1MOiXAjS86osqAn5lGOmn64HeNTM8B0onIU3zgGt/8Isn8pSsRY6Pl5jboWXlYl6hUflo3xK2A6nJ4/u2/qyP0ZhejiNKISD0OoNpXrmmVcq8NATPdroa3hVAFUdNtoTOk7NHLafIw==
- VhRJPNKvDF+oI8NZH4WcfrBKzYXGPR0s8mz9nFbu0YdiEbUS6eGauyXxXhLKj4cSnvp48Ek1C/aev5FPKvcXGYW/hchlW6FWCi6HZ5S85DcoR+2Vsj4KsVAfWzuDlp3f8/VTBHk79/o0NGMDTqGbbVizInXj/5noAk0n4SUnHV30lhnfU+Ru1velPUSP2hv3m9mkI1vA+sCtxRbeaoylkCtZ1FxLSUV3hzHEy2A3pnn10h8Y0rNXviF3GzNhd3ivI1iM0eY8mvKF70lUAF/OIWG2QHpUhzj34TslIO21C1gT95HziNOEdOMPgdPtKrUXFPNnybhstM0=
- xiST2Ia//lhEncy85BxEbJfzjV3olED/it0TKxvKhSnr0E9pBWXsYWrTBbsxAHD2lsQnuAbN+MHbVe9CN+bXo24Xwfwjkd6VkgqSdoEsrfZu7d/aKuftt9zh6I4+VmybtFHtBE+jeEGdpiJlfHwWlDuAqFM4CR+MaF8UGpn5PtT7mm8MqeJ0nTkHw55A+rrpI9uEo+mV6SahFWzNdBJ8sxRAyqJ88/ldldpV7UNNKPnAyIVk5EtYrTh8z4Q35S5xV7nZfDT+twNMcx36iIO78xRguH3rfL1/+Hp90n+WJcu0I946WE1Bg10UbziVdj58ZM8zfa7vKe2+hU/C+/N4H2AR6TUn53Y5FjpOvOCewVz1gb0vujvNr/y++HwpOt6v8KEKhB7flHrSvP+txKKRkEWGaVhQXbBDPHBLR5HkzfEyYrFmzf3bWg==
Question 12.33
The comparison distribution: For each of the following situations, state whether the distribution of interest is a z distribution, a t distribution, or an F distribution. Explain your answer.
- /j7YdT9FymW5A91LCpYSP6mURElO1tGVpGDV6L/RyQY/8g4TDt25+fW8HXJ9/DP9wt/Te2DIcTuSx9tHbdnPRR/MvETBBRkzqxQMg/eN+/NHRluU6zWtSAV82ZrZkNfG3usG8AJdGQUGRi6aIgdHwoSmOW+CdSDNMHln1fXztM5wfjOcPtAPvJw7yQbrefEkJ80/jL7RMh270N8gSRudjxjQnVKxYdlU3OC4w041FoLKorN+ZgkYQxu5rVFfBedtL65RH3jGbByzjtZSuKMD4jrVa97ZosQPPnIeqcyAW9EU/qToVUY7O4pCg8fP28I1rKZ4t4zuL1MoP893+JUBwYb4Oqhc7Fg7ThrQrdgoWrBXBcph
- Pw1s0GAkrKkUcgV96p0YPNYDlDgmCfr3vqnY2t9ovS6izJ3Rhf7Lu3JXdgnOTSikk1UInPPGqsMOeTnyR5HLkxCgZVv1e4ubRE6dKFvzVnAvk0dk21Ql3R8uKZuqZwlrZjH58L8nsPN3/2lXiuitiSNgBc6JQdn/Rr4E0LOMH2ktTXYWH/W3LWb3VUQsqpBM4QnzDVIWHi+Aie1hNHtJbjPtzhU3DBvItxxTySq54dqXlVsw5F8F5yuusY6HRMzcJVO2/CfQbsfzcCT0bX7a3537Pr40PX62Lae5q66gZkG6fBm3cA4aItheKiXvfaobMOGzNh9+KG88HGFuGGp9uc2cP9iV8StAcP7RVJZYzFNhi/AD18pTcNIFCXWAKA+XT5aMo4gfERyo0Ra5LE+GmAk/y4m1G26PoGjebTPAlJKeviKA9Je1DTWh56VBSCoXwfkzC/Jp0T9kmtv9YgK/iZhsstQLANMTvYQitpK9+8Ld4+NZ9Sd7C452H4Htaoz11vXtMsGl+SN2PH1CKIB/emHVmsfbDWR5Ubi1t9TKRA34OOz1zRafpaXttft6HQZrFNHYoAo8S8pb4VslsFTAV6SXaCGALgPxLXhOv55x38rsABxF7Ddz6qh2nz9Jbfz98ZLreg==
- FFLNK/x0QPH9cISLcskTiivvBVlgrKQAK8VyOQ+/UfNawqhfB68U6T04Lj1HsCfn5mLmWEFkc3c5FqRuhVebnS+ZOTKP4v4lgG6vhaqBwrGuZthvw5TZS0vwZ2BiwG15rvXdl1b5a2GxZO77kjK5ipnzItfMUnZkZpboDmpjy1gJ//1FKoYBE6lbPb1jiSnOOlvhUxzwYsN4Hpv5HcqVuU6eXmLnFfopUyMcEf2NtZj1GkeyW0U1l3aFT8IZrq0sxbpMVfvoxJ+HW5Iwpr0ODnlXO3jfMCOXhNhwlR2DIS68r5o4/E9q6bhCi3XJPVV2eoRX7GTpMaSIT5iek7RAQ2QlFGZkkZwaskkg0ViUFfnUu4ljGscbvboM18LBBC0GSrzOqwuOdZArOToISlnfGxYJ2OrB/IhV35Yxqg5CYj22PeRiM1puXi5XsqdqDI20jwwid1WXX810VSzub0gDtC/LVqv12W9l4V2iWo4ZyhRVHPSMf25Gln7lzdMt5ZJ7Ec2FnwanUgpJdt68qM/riu3RAbeLvmhLU3qHKOHKf2N/gQx+0oBRVFcHTZG6nMH3KykTXD+b83XwACxAw5Brk+gpFE1Wl34/2G/opXs6lrXL0kt+mfxHcOOl0EsDqT7/1BDsnX/BEuYcFMYs
Question 12.34
Links among distributions: The z, t, and F distributions are closely linked. In fact, it is possible to use an F distribution in all cases in which a t or a z could be used.
- Jo/UtMdBiOO4DFBOKTJ4NhF3wLJoiihTtZYJ6VRHgVfHk20kUUd/VsooJW/l2vHXykM1isbiD1uzr2J3f9YDSNbXapSNPgUt3HRmQQH4y1ouxKhimcspBtElSqUghYQz+CWTwGCI5Mb9ckIpqsKITbyRZsAGqDG5zs2YnprdW02u4lNvf0A3vdgsvgMtK99ljL83teX5qFB0FVGAENM1rIkmjXuotQI4i7jbI025zUHPunhMmb0x9dd/5oCLupmEH7gFFqy1qK0cs8LDR1MOCDh/mEeuMF+6EaMyGBZ4baHWeDL5goQzSEaxSritgZMNwlMKsVJiZA6c7t4Uq+avCw==
- NMf5R9mOaUy9+K7RWSAh/NbBkD0d9BYTyNvlKsThPBL1o4t/k+Agba8CWKSjrEh62MLgTxHVVkYNV9ACvrNgEhgXFtkRwaE3TVKQ5X6PLcMRgUzEMKrJMIP2UgQThejpYELqnuzr4QQwmf+K2LSSOGIU3PuFG4irYDcNrE1Uxodmn082gUEu5MCVrDaWzvkf7o6D2RTSWOa5mY7WYiP8XNZevbuBcZ9vhRK2wTcvUMW/wkRtxIQWUQ==
- QBfikSTVg7dhlAH58bVj3NB737yzLfP+/m75mtEaSzpC5aeSCmuZ8gmuGpkgWj1dvf77TuDIREop+Wy+QqoTWuN3bWFce4iOHThbtUREmOSkZT+r4dRFCsoVcvlp9C52RjhmQX8W04ENDqDMhUFIjzhVMi4GkoV5zPaAtig9qFwR3MfP6gBwGtqHJ2+Kv9PDqumHzENl85gdbDps8hBMEME7kRYLm09LzRR7+yo7+M/SJP7y
- 83k4Dh9Ax/qTIhQfwHgvhdXKv3VCe+aVwctmw1LMdOSPC3hxCTrueTiuT/srKrJ4ep/JBrvV491n6oP1ThL6sDtIwJv5cZTTckHnPmb2ufInLDlk2eTaDYBChzHLMdQTEPpMJCNuqCveUp+j+pmlpxzA7dEIzlqly0ceC3go+FuNzW6EVvmE5/T8Ih0ubKL5tJ1igiBEZb518IQM/Pt+Zp+O30Wvr4UQZbH9RRieRNHBL+b39y8tdT+E4QY=
Question 12.35
International students and type of ANOVA: Catherine Ruby (2006), a doctoral student at New York University, conducted an online survey to ascertain the reasons that international students chose to attend graduate school in the United States. One of several dependent variables that she considered was reputation; students were asked to rate the importance in their decision of factors such as the reputation of the institution, the institution and program’s academic accreditations, and the reputation of the faculty. Students rated factors on a 1–
322
- JT6jXxbVkRcLFU4IwsmVHGjswRxPDCSC1P4Rf/A3mNJqdtat3CyIJ9zWxKDkc1eAmO/tl7mZ78jn3gt5aKjzZMrkip6v0OzxmGX8WEOfYVWsOmh8SQNey9e3iPeHL/AFUm5Xf/+4w/3OzI8eT+x9PIwdllP1Ew60vJydQgmvewpW/Xgs2kpUWa8j9NfHayWTWMzHz3prYdfbFO0tWIb1QVbkWsc=
- mHoy/GR9lJQ9Vhu8nWLVyhsCH++7P54C6Ym2rmtTu7lu5RyltDplqAZMoutkWznGEBGZA2SdwQ/xXiTP4Hf8kH4/tSP5BhKdcijbTOzhz7uzVpfO1oGXj+vJaIrsx+coo50YZuKmlJt6VBIqcRL7FdvM3PfhW8C3UNJuneYComiqhNP1
- awQ+PnJEanJ6VMdzlPjw7n44yGj7TZ31TM4TE67I7JZlQut0LW+m4Fq++h49jQ41LcsVsYihovPdJ3Oe3Mi4PJcSGxJs6g+hkyVkOxrGJhSorU88CtTu3/BYe8jsGz5Q7mkYs6aKryF7E+52WBW8Kz8yLMPGFQu9Km/0iQeSgQDr7d77+3ukYX7RVH++RDFoStQb5A==
- iLT5fLxvsUi1TqUzOrtkGGduhLqqrOymo11hr3uDOxI4Dohz9awpOrnT6Mg0sdxiOYmGPAVN62drGK4VVQeaE/UOdX87NCtAALbAS9kmDP1MCQ9I9HKhmg2DbibuixhuNOYxsWnGUb0O9jmMewlx+0zEwnzvaWm8Hqpjuzl7SrUBce0TD3SF113Dd9P1IXKwiTd4IKFxF25QHz8lEKy5w5fc6DO+XGXGDkuQOCls2xmg8OCm64N9AdXrvi9hbwmMIYM4dMx8tlQbBTi5bKItVO7Mbwi9q3ge5chsfk0uNIYoofJFgNIB/w==
Question 12.36
Type of ANOVA in study of remembering names: Do people remember names better under different circumstances? In a fictional study, a cognitive psychologist studied memory for names after a group activity that lasted 20 minutes. Participants were not told that this was a study of memory. After the group activity, participants were asked to name the other group members. The researcher randomly assigned 120 participants to one of three conditions: (1) group members introduced themselves once (one introduction only), (2) group members were introduced by the experimenter and by themselves (two introductions), and (3) group members were introduced by the experimenter and themselves and also wore name tags throughout the group activity (two introductions and name tags).
- /p9yIjXRLzFeYZDsqbA5IlYtrxNRTI8gE3azKDsNtUFVr/OI3VFx+nmMSEqfsKCdVphVvNOhFmyUbAaRhfdAdXSIlUCwKkJ6C2ElSkivENhXWJecXm+3mfOn/WJyzbyjYxqXlg==
- PPh/QAuX7elnvdcJFVWiKdcFfqzjciXTjlYp7rIReoTczbgXHnJnAfS4j42tDZHp39gFTKS4QIKvfemQCr0LN49eTjxAZ8fTnPI76qLdFAYi8fT/kC2J3EOxmbrwSkZfWZO0NmCt0QvJoiOuPYd410+mEGjGwREgzTJOjL8yw8byGvSqKbj7PQ89bggiSAZAUsKwfwJazdFhRkVY9wyRCHQ0AAp/RY238bnP8Ju8QJWERgqRd8uyT5nkKMobhbdJDtlwd1N/BxoWF0TzoRJwtPIdHuyzHkZ8ncQxeI7q/Hqd9boiYBpdhlhFgNccQ820
Question 12.37
Political party and ANOVA: Researchers asked 180 U.S. students to identify their political viewpoint as most similar to that of the Republicans, most similar to that of the Democrats, or neither. All three groups then completed a religiosity scale. The researchers wondered whether political orientation affected levels of religiosity, a measure that assesses how religious one is, regardless of the specific religion with which a person identifies.
- X8SUwipemz+wp9ARKHM+ucPs21KpnL7Fc9quX9nCTZ+2DRF4SXwvFoSXSSggvs4oUurUmjEYNRSA41SupdQR5PAXsJOUTtShD/1E8g==
- TupEhpJe9+n112TpLjrMVzCs5i7zYEgZh2Q3kuxeEw6wxopC9PUyl5tOzrs3scbN
- LA5yq51DbysA2fPRQCX2lppaDEAcyK7lori7Y1InXtyL9Es2qvULpOasaisxKs/CI/X/12PJ3vAoN+/O/EIdkpqqtKw=
- C4liojwZz3CrO7kPiJcAV6zbeINk8+yiTrHl8FnGTKOh19S89iMdeAEdnXAHKOEKQmzNFEnjAkgIWtBCHAxA3ZQJ9MNDSQJbqVtZ8hEIALiow3UAdd+ayFUpqr6YZo/u1Q5IxwEG8tQmynK1+w+RHGGiuEf4W2UYD3JqFdD0qVdPvANoHqGvNL8grsb4dLXv2UvN66MjDHLBpgi4owBUjQD99FW2kZsBS4MvR+PYW/8=
- d46TK62j6REwycWPDXDbioBFPz/YdV40C1D2eZ6dK9PvIqHDjAaOrdb8TSNwX13AXkBZHOtIGGsJuJr6B/GYq/9SnZMURY6ZYuQY5xT4X0gnu/Rhc7VEgWY3gd/kGv4M
Question 12.38
Exercise and the Tukey HSD test: In How It Works 12.1, we conducted a one-
<5 sessions: 155, 120, 130
5–
9–
- C2oXyezTzELZlDhLiNjut8CbaTH5kxmOvUsl3QNZc2tozeG3RYJ1Slyld/6BuQrVrPst6+GygvcKdqGmhJFy0RwcgfCqQikvN5OYx30l8GIGg8kDDE7hm3GPveEwl+DpWD0alxnlj29cboO2x67K9qRvzaCjOiDdioEd0/YdJUVQaLwGDB3n7rwVJPb1EFA6NNssfQIkWTIJax9ajm4Eln8c+cYHHL0k3WGMiilK/krrUEzUUpNOVSxOQ5s+JldqN42WnghmsuQVpwj4ia4iJpUC6BQ=
- t1jybPpWNLsT2xCIVwedgi3xdoXZuuCdNs6jChxuM0L8SaZTp081iXZ5ywj1A1OD6qj3nHCkgC3eFCIixzfWSi8AyF+OX9je0tCQyExbh9gw6QJWLbk0a0XN+hEKXlURamAZ2rwIG9YM1m1vLUbquiwTSNvJZlLLzg+pV56ikwAdMtYT4WuT9A==
- JwjeCMizvWtU53xShbgV5cZ1MTQ3l4jxvC2m76M+OYAznydguYck7vHhMVR1w3H34S8xPL9K8m7G/gSD/VsBjBr6hOCp+Y5Cvve8D9VoPP1GiyeRcgJwYPoG1oJ06/teV4mkdlit/Po5DDo8SN1UJbCBrZDzle22+dwhq+CT5ZgTju9qTZqCxoOTlpsUM0fUNEjNhiWRmFw=
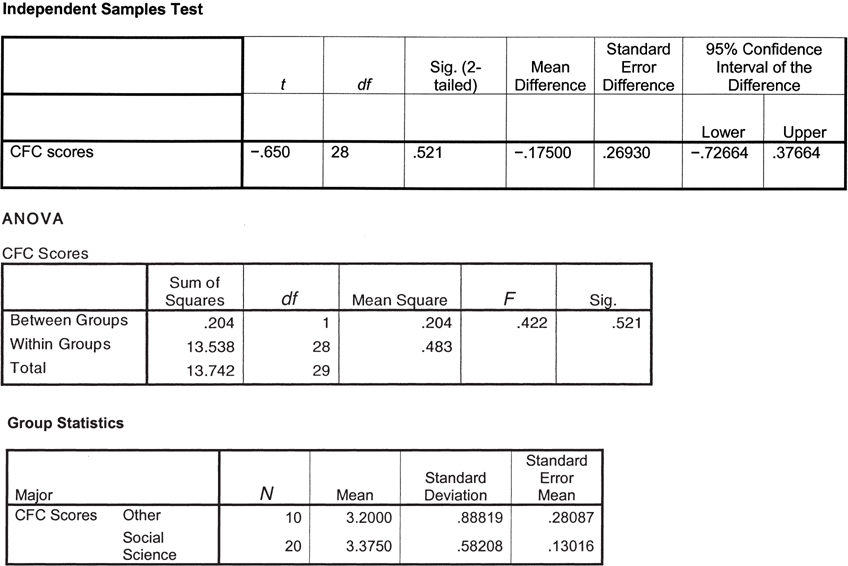
Question 12.39
Grade point average and comparing the t and F distributions: Based on your knowledge of the relation of the t and F distributions, complete the accompanying software output tables. The table for the independent-
- NJ7nWNU2A/VS54qVj8ZsSpNzFmsYm2PLZCQHEtPtJbpTXbbWmkCsRJ/AJaYzxu0hxueoqg/f8TvVH/GVtphr1EaSQgII1HpAl3Cr2l36ecQDL4O+O/7RZa8VfwJnKhJh0mjgixlvrTxfE9mj4gekTfp5JglQx61owk0TYOw8k56Z0hJFuHy6JJzQjhlx3ZBMWEz3+PNYqjYAu65ns7MzeeK1Ot1D7E7WhDuDdUavfXAvaErSILV9mYBiFMtHIAc822ET9nmlXkxHB5QT
- BuzUTwnwIAx5Ym+HSPC1b/2uTqIXIKBZBxS4X8EzC8cmRAkZEGBNlyjd29PUbUz0JmGtWqT7snLkTsCsgwF5CbacbTRucFZTnp9+0RFTz7W1G1oEBLXay7GBT6fOXfeK2AIb+jgKUYTakDaiApuTc2oLdRMos4K0sgZ9FgK/jWKzl7l1j6xAOKAxGI+//a9QrDU5QQvIW2U=
- DwR7w3yr4eyIjIAVVWaEQLfm7+1Ou5FCalfmLi9C9W1VpI5BnJZZekqmdupLVeCffpCocm84ePr5nuGGji4345y37d0lt/AFU/XcV+Eb038cNR/KI63EuybdLr/VVncUNHvZHMuE0PrQSkiS21loGuJQrjiBT/5A7tZ6agYi7zIo5NtWZ4cbcNYEi596n6sFbjPAqoo8k7wE8/M1kGvWK1SWqb2MxXpZhAnvpiaES+3Qr4/5F3kddaUodPOLQ2/TLUHcvYVppAKz33gYvhO0GnXy/6BI4Vdo9/gsHTuytJuX0QBQDu10j5QdeKY04qa+AascQ8yIT2kcbSnBQPbbP4gK4s9BbC67A7/fJTVAbaWSWeU8xC7ypsQchCYcUTrtZy+xkgZ0RKjv+Y1Osv29mAcUXPGoMu0x1iZ0My3p9PtJfd6yZqIF6QlM+f2FJMxSQGsng4aex+gCJWftouPPYpQ+JUI9/Rgn0QTsdXFVA8mXM8g13fzixcdO9H88Fhi8E4/xmSGn+LAbpNbdWxNVg3xGdU10hTk/cAnDVZWg6uwviFqVbwk4kLMoB7Czl7o2MZtJoPqMCzSz8Dh1OHSyiAawDvpRmbZQcb5UhZ9MyyO4HxOwPjDSdFjwYNKx7w8BPfIpCzvpmZufyDl3XU4yupXrwUPM2ZrVIM5urOaMXU3kTzbyk9UN9Fov61zx87E6koEDp04EteycQjafxtOeUpFXM4OeSDywR8Sg5n3E7xcQJfz9SRlK9LHZjHMQhz600nhKR6pUdbbZa2yMRS9KJR7km6PYIULGSu+K6kW+4NRxcLo7Dvy1KlNiDVfPy57cLg4PwJntcepvVFlyZcp6EYdChhlsYRhkN9OTyKT2ryVK4yNA4u64zYO5Uo1Aot5yphQNHlGUiY55nQVKtv/3i5bYwWZ9S0Uglh+SddkEajng9riKp2ETXKfFuMmzqvNfHkh4uSVXrZ2tPiQNNakchbZOEo1ZadVSTbC/QrIRRugQc3/v9Js7+zOC7azVqoNR8nfAPA9jBV+UQdG5dv9TYvX5qcrGB9k9/pDwLFkim9/4A7sTbt+muLCf/l5vXhJmNwgFproe/o/asN3VvwCgPXBmMqONhYRDz1c83bxLsISvtweXIpuHpsabpNtVdEFXPPKakll1PoB7EOEXXmoERhqJDgv6bbCbSNA7RJn5RcyOJiOgOTsgc4DHoN85p3Yy6bE73ACpqi47CkN6C3892TZeUlOiEfu1fQXMQsLovbT9wnBPdpjw29/jQeFidh4Y6fvDzj68PnD1tbdZIqztxsDep1T1cDr8LGNZyAGfxPcKrmXj77TFl9c+2MiwSkgEvtAkPh+5If04vQN+
Question 12.40
Consideration of Future Consequences and two kinds of hypothesis testing: Two samples of students, one comprised of social science majors and one comprised of students with other majors, completed the Consideration of Future Consequences scale (CFC). The accompanying tables include the output from software for an independent-
324
- OeBeFaGlK6lsvm5eVgGHCACetGFFUu8mti2Ha1tNZStnQDkm9sSryJjiAIWjwy5bWc5hdjkZdXtoLCJcLnAn8I5bbPaj4zoeOe+Jf9zVIrBTo4BXDg7aEvCQMEfoi23fMMOpF4hNIykyh90M6QJRoAU0DuMyCD0hJ1LN1y5sHmqTkYTT05bof4rqGrGkjjUsINJlQJgFgdY6siqgX1k8uMiu1+tPp+QdY5f8iIfIr8BwXle0aP/fKwEirMWaUjpILaWtfit0UzPuWpRsfAC9XwYY44KVs7VQcupTKc4zHNYBJOo5EhOdd8XBblOlmMi1J0bxGKv05atdScnO9lCty0fSSeEv8XcqdyVX2DNHQ/U/9yAs9rFYDe+QeomhviLnYAvxhsnRyxBkDBWOrFhFDhNJTgVb83cGrraWz7vJcwBQgNR3GYaXIdQqNcap8sXzRm/NhmigTGHidKlLCW7UtBabjeTt7hDHn4LTHbUuov7EkoWG2/5RqCnf7X0hL77IkzWVbEVTTT/LAa4A
- So9OVws2HKK8/KqJZ+Iksdyqx+DA32JAH9c/GQJ7/5CsqFdHYGjmta7R7CHwl8w8GU+LT0qjv8b4oK+7Im8CgPaOUBSz2cHlze2SzV7akxO+ysozOGqeyd8cFNt0o1hnUSZjJEmRQr1URBskuH4qiNnnK6Vk27P4gSl58ekDK7sNzBHv/EmweoxDKwlFpfN+gRJadkLVqaBsmzxrkO/XD7QmkIwrFP3cQUC7/dZ1+hmgmswk/ui3qyO4EMIIuV39iUPUyjf3Ssb5+hB9AaylvtYVM30nRTE/bUdgaroIweGm/8Hu4HAb8FJ0zxF5dnOL0sCvFedN+RlyENIelO48XHhINjjBLgMm3nqe+A/RLTaXLqZWKASrMYEYlW91qepJ4LmV1Niqi9eCDREQ+vbsu5V3N8SixkZ5CF6kLRHJlg47wFFBhIKf29bvQLA9z7EfkJb+cvAsosZano7eltr5uST/Hr1LaJwT4bdgfeuNqRQPyW2RFPlcMZx4eNvBLUz3IejKrIq8ThjOfp+ME0KAScpifJEtS5P6DIbB5b80bmXyFXbQrsDi4XRKWX48bzOrMQXIeSXQSZn9+0Pccg39XMDPAEn1lYIbnQ0cgjZ4TZWRLjGFBdhLt2W1D9GD9VCddCN8qH4WrMklET9RGI4f96Cn4JMVNan3Jq+uy/SwuPP9sJdIyIOtyq35re4iWzFbSKC7ltGvpihDvRtYofQ7XUY8vpRBZcqcXdZOYydnoBb///n4FSB0uQU5F4nehULGyMQO9Q9XTp2kJx+uHrEg3eFDZayR5GQQ9M9gEJEURfzRpwDcy7WhCC4Rafek6p0+/kaG0Svw7ovv3KPu
- bAxqsc9lEK5pCK48x+XiaVLPWPi3TwXvYzUrmimBK7jQrFHz+DQnneeYDGilBZN70fpTMnnlLcSGAzH6cu0QVNUOse4PaiFe6SGu7qW2zHl08330EEBO84DFnTftp5/SUb3cSR5yehMJD31Th8NElBuIjb/pRFONi4T6jlcLELrYscAdxylK6gU2djxsuLeQPLt+m+YyUF7YcLSmPQDMZp6qhOMB6B9Nw0Sk9NcNg5yF3FjATbYJt/cUjtV2+QjGbinQRBS1w82gtxwZqJ4908G3YqoWynSmtfcizg0+ydpqT6nu8M2hqyYpQN4vlNB9azgop6SYs2fFbsryxFoRpP/EqHV7T7OJFUa3bh/P6KHEx1KLZYtsB59xjhRqgIc73Jzc+iDKbsn+D7ESEaZI3ubUv0jEdzFvsL9V2kfmQVMd+5/I
- mtEz3p4SBpyNMJZhDsuGQWk9DoktZw+hUv99N1rZ3RyOl1cE7wXLb+HhoEd/oUT71F9N44ztRsC8uPDey+/kzUrh7PHEx1gKPtDhDVporwC8MM+rt5HsXF4OM4K8XIOjTvUsNQD6PsyqsKogpRhxOg==
- IOjT+3wB3FuhtRo6RdTfVXFlYiQDwvRoRK1BHuD97v9JcxircNBlqxetiXYZH7rBwVVKJ+2tM2iz6KYpZruZngkuCqx5dJYWiw7H/RbWOKRMjkAf60z4CCopXDh+UBXpZTapUPFV09DcBr2+LhDwN7SkTOmWlJpf8F7jxvkjsGw=
Question 12.41
Instructors on Facebook and one-
- OkygSJjbXVl3crOvUbPV5gqDvwZWDGY3HHAFTcYL261LOhSUT50OCwwf9/PlGYF4Vob1v3v79FxA7xjAlNYIaIXOvnEkgVMBj0vZFWGwHPasrWZtLipGHWiC1AfOsHm8tKr4ycQV70s=
- aOni9qT/2s4SknoJEHLRUpb4gHY+qos5xu7ZNmZ2kAiQFll/deRnt0R4jjdrQQwKC6ZGmXIZQdQopweOK2LdMKIu7T8bjWraSl5sLxWqQmxgnn7NhBjCFh8VSZow/9K5e6N/mg==
- mYHJx+OVtlxlGnNJTwxJRG5FhrXsSSrsWYK5aFnsyWQsgQR+wTupQESGJ+SBytwwd0vi9RjOAEVF+AeXaqEKLIldQOluMUCOhR8J1gozDfBkf0+SYqJVIBLDfKks/fonqWkhqt2/8CKs/JW8s/LJ6MWj5e2ZJQCYGEHMhWv0GK1+4mO7iuOrG3YiRwV6cUjzvSm5HOq8Ard//pTeT+4kihROKlNWrV79N3CLz2r7jkDrpqGIHkXb1on+WmT6rVDL
- 50sfUS6D2zcnrcRcGlEgpyA0tb+Q4uDKj3la3LqI1aHb9Q9C8b3AUT5IqunazGK3sG5D0urwJcHWItXO/p5aik0o4aZXnUB3XkMD/l8Z3mF9sGtAvJdfKPRNJJyl9tvY2F/CZFS2cv7d380a70QsqhTbdntd+cpSYa0ykhgys4zEA0y5p7iF+Yd/TWUzdHWnhSxDUVnBmyo=
- Eh/IbIS7wOxmOym3E1vn2vfzrtOEbanekwk7orGwSFRaFvtvEXtg0+YNUFirdzDppJOIo/GpTL+jvnsUOPkiSzohtjtl/mjFgJbBI39nS7mu/yMasmz2hn5YMUpXZqaTOUOzq9r6qJtuwL7ocq4S0joGIKGzuMxo7csLQraa0Hs=
Question 12.42
49vW9fN9naNkLTQrUHmFNfyHL6hT1YVFDKksr1PqxMfv5Sr71VHUm1E+F5+3lJCUcydkAjOzRk3g3t5eQ6k2m9anGL6xYmJR7MDSoahbw+rlxeRTfT900ZEqYjhOAH39wlFvkF31iZfVUj8LJNdpA/z2SRPVpZim9NzwCurl7NVdLA4KVZzz61dfqMeIHyLIenE536cEEV7F0AjsQSTrHp0X6IBwa8P5qVfNBCU1VXW6raHZJlz8+7CuoixlskFlSDQzSfUTz+Bd26FWSS+aFKGPrIcSTmfIZng1JA/r5TRqTKtJlrt9rd5/jSJFKkuCE5cv58fkieG5/9C8BmLeS+uYNT9azfTUGARinSwXaTGvxaRvvf0K+oKiW5KYplFwpMAASEizkw6F7o4xsXorUXLOWJZrK/judzvstwvb1JNvvZbLssZumtDXT3EidNu3z66mdWK38nbCiSA6cxzUF+lRnBumkCqVYL0X9a1jn+5RkgchUrNY/bibH4tjIKxVAb6FiCbru4jiwB6qQE+2EP5POb9hIiZAXL2ntTVpxNSLTWnAXA7y3nr6mqcQkxvx0jaMk63TrSruqejXF4OZff2iLYaSmV3mpjxReW7xsTb9y6ni/1MTcxCE7ppt1ywe3SRCFU7zaDwEKoFlfcZbH2JZu1M=Question 12.43
Post hoc tests, bilingualism, and language skills: Researchers Raluca Barac and Ellen Bialystok (2012) conducted a study in which they compared the language skills of 104 six-
- E0cwn27q9y3jXzC8sMnucAkKaHYJZT3oS2k8sOBXj7m7RO9RlOtj7XMutOMJLl2fD1xvZYKy0TVWvDDvB1hSEidMrrezbtJLYm5DZbaEeKbhR/CdbQgeI43towhGwAYzi2pTVFC8e68oSXJvPP0TNjiMwz/d001egcWHhF+Yp6MtsDzPRLE33PjDNVhmbo/UXFu+Q5fhiFSTCQoKk4ksksJ3w0RfSEa/
- em6+usD4wjp2jxhqC0LLfV5TXUUywnDKqqziUctiuftjvi99uI2obXAOSj5Oi0ftvPHk/OyAQANzgVjEGt9AyXQZq2WmYH7ZCUiOKNvq/5Q=
- cBPOlRLRmcwoaMIsXmZg4dllPOkjjxzFI2L3o6rIqV9YziEgeqeZdE4TFzttIkFyEpWXrh4lOAR1DeM7aGOygDRnBba7v7ZymPvGIW6c3B8qsPy5xrxq9556TITBJPWFPa7j3gzupMd5lUBGRjBq3batuNLAhKrgE5qsEvbeU0BML1bgIwwUmbN+dSoVScGr
- 0Ruyym9nt+MeTfaZw6odFCxmAtjS8tWicZSOlhtSPeVrlzg6qAsmg/VJr7o9LJCXQenRfbCWSsFUdMvSHlrPCy90xNw=
- ed3VSVlSd9KuEibmrEY+8zBrKyScukgH2H9r4aQHTX1CZbWzCHc1dOZjTx5zLWd3IMth9Ptac723T5oW
Question 12.44
Romantic love and post hoc tests: Researchers who conducted a study of brain activation and romantic love divided their analyses into two groups (Aron et al., 2005). Some analyses—
- JJ5QGGDAX6h6d/HVx+6OodT5q1aZ9HAiXcGwDzvPXA5qUqBtDX7+IFYDnoVqDI2AwbXXJ/4oVMwhJaqgwLcLeX4Lf2WVVklGEzEkpNRmSSoCTfZRQugO7OUAsEn2Ud+yAZJa8R1M0QLkVbZm/pXfhQCWrwtjFrB1POD26w==
- M6r4Oi9fe15LFbo3FNLX1HPgAf8BCZkGWeDhDSo7eF7dtARD4HLU3RZ6vPR5pyG926rXrjQSWaYlROF+siZdav8mAaq25j5n+0tVaLlZGOrs7ykTGJYT9/ybCsj1ffpePebKSBg5oTS6FyDkY9M+4WFD31ZNdZvvwqL5mkiipEQ=
Putting It All Together
Question 12.45
Trust in leadership and one-
325
Employees with low trust in their leader: 9, 14, 11, 18
Employees with moderate trust in their leader: 14, 35, 23
Employees with high trust in their leader: 27, 33, 21, 34
- 4BjkZXeTD/JyX0ZAo5h5FaQ/A6K4c3+FTAUall+loRC4lZ4Zp2txlSo+3QduIoQ52viBwAHD193oY75TiI2MqjA0fz+1FgMW
- TupEhpJe9+n112TpLjrMVzCs5i7zYEgZh2Q3kuxeEw6wxopC9PUyl5tOzrs3scbN
- aMmCmFvTVNUfwJe3iL2AelP2YMN7uwpnefiXQznAHW3k530nlVFXPckrAkolgSkUCL7MsKz1QvKP3GdF7cL1VYaLeQIu7qvpP+lqzTUnkRSKh2pkrigH6bm8jGwvS2NOKg+T7Nvi2NUtwHxblAgKNh2Ye+SBJeUSPy5mUccb2bB0XeTPoxMbzHsIdAb1K2e6EaIGeuvNFFTsXgo4P80sE2omRsVukpVAXP0ajcFu8rM+kpt/P7pB8q9S/+1oYXE+
- Mp/PsqU917zwSHdcwLG/G7h5Hbv9dwQCtVcepKZjxWMYUHl24p73MMO6I2IDgUYSWf5bFWIrrAOCcylT+sB+JpU+77h2AZaUZQLr3g==
- VvXDe96b1epg8HnXInGgcnGe1qQUt/gB83nLxJUP5D/rEboYZ5qtiW44UzC0c0zlBVTdoV6ooQqc9EhTorltuslaDFFIyj15
- TOKcJoXv6v2nVvxcsxBUgWRd7q8Nabf0a7qf7Qm4OhihWg1u66luuBTWLIwabYaqp82/EcGtWpQtgMVMiSDh2KizZ4RkB+o1elok1T9+6xv73JIWhVRUKw==
- c02ZPTYEtRPc17cugHM8FRSLQUaXVo3EhcaxWdTXTwsFocuh1ywj3CIb8MM8S0Lf1O78r9UmtipS9ANyqfX9uzZ/UWK18m/yONIwMsivRQZ4nPhDmrUB2OZqm/zWltWGgqICTJGhI4ih4CHBAF6q4MyM0GbYORg3Q55PCZo9q722F6Wl
Question 12.46
Orthodontics and one-
Primary school: 16, 13, 18
Junior high school: 8, 13, 14, 12
High school: 20, 15, 16, 18
- 4BjkZXeTD/JyX0ZAo5h5FaQ/A6K4c3+FTAUall+loRC4lZ4Zp2txlSo+3QduIoQ52viBwAHD193oY75TiI2MqjA0fz+1FgMW
- TupEhpJe9+n112TpLjrMVzCs5i7zYEgZh2Q3kuxeEw6wxopC9PUyl5tOzrs3scbN
- aMmCmFvTVNUfwJe3iL2AelP2YMN7uwpnefiXQznAHW3k530nlVFXPckrAkolgSkUCL7MsKz1QvKP3GdF7cL1VYaLeQIu7qvpP+lqzTUnkRSKh2pkrigH6bm8jGwvS2NOKg+T7Nvi2NUtwHxblAgKNh2Ye+SBJeUSPy5mUccb2bB0XeTPoxMbzHsIdAb1K2e6EaIGeuvNFFTsXgo4P80sE2omRsVukpVAXP0ajcFu8rM+kpt/P7pB8q9S/+1oYXE+
- Mp/PsqU917zwSHdcwLG/G7h5Hbv9dwQCtVcepKZjxWMYUHl24p73MMO6I2IDgUYSWf5bFWIrrAOCcylT+sB+JpU+77h2AZaUZQLr3g==
- VvXDe96b1epg8HnXInGgcnGe1qQUt/gB83nLxJUP5D/rEboYZ5qtiW44UzC0c0zlBVTdoV6ooQqc9EhTorltuslaDFFIyj15
- nzJPYB8vSNCnP20AOUm8UWQMI5kq9RGPghpJ7982bPLXyVr950yclA1h7r0yi8Npj0i62iZAqAwdxdNWRrqqS1/BssZ7bYXivWuiOfMLpTyPJmug
- LL3Gvjy4ew3DYgHwrmJOenFFMj2loL8uhf1nzAjE/vMb7T163ZcxyFuvSQKie0Gs2sfyuygCC2Qdwm2gIfq96eNKeBVKsS2UtwAHIWO+BMereCoz1FRHMHGNLDYyz59X
- qtZ1D/3PU2xj2UwqnJ3WbmtwI1TMYnpA9Pdx3nQlUjzwjf0EwHOJmVjYRohK1226FzL5jXwb6WIatvxhHAB3C+rjN/TZQRXT3+v02tGUbreK181TAvk6WWpe4N0fWVUgDDoKEoFBfjarjqmM
- 6FadrUHOnNjtCZdFS18MvQ2NS3H+sWQVS8EwZdNmZPaTzXf7w+tFktVYj0ha1MxjKw13jlOZ85AyAy56mf+KkBeqzNiOBI5T5m3yt5E6yGYhLVOqMh3by2TpfD2lueQbEtjFfS7JpJ8iDHrgTheq3QnmDvu09/Rx0kcHjAgHE+I=