Chapter 14 SPSS®
Let’s use SPSS to conduct a two-
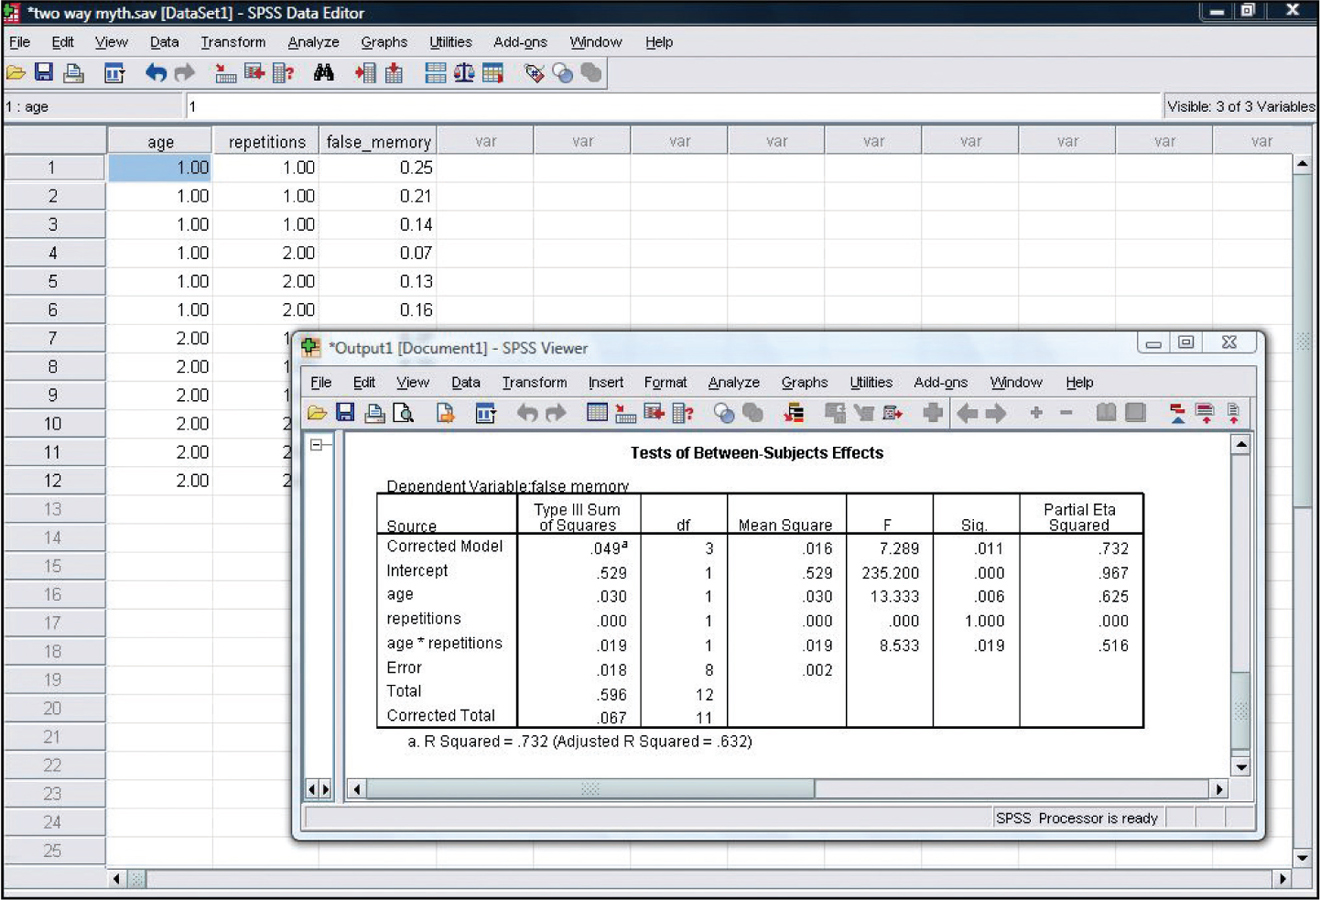
We instruct SPSS to conduct the ANOVA by selecting: Analyze → General Linear Model → Univariate and selecting the variables. We select the dependent variable, false memory, by highlighting it and clicking the arrow next to “Dependent Variable.” We select the independent variables (called “fixed factors” here), age and repetitions, by clicking each of them, then clicking the arrow next to “Fixed Factor(s).” We can include specific descriptive statistics, as well as a measure of effect size, by selecting “Options,” then selecting “Descriptive statistics” and “Estimates of effect size.”
The screenshot shown here includes the same statistics that we calculated earlier. The small differences are due only to rounding decisions. For example, we see that the F statistic for the main effect of age is 13.333. Its p value is found in the column headed “Sig.” and is .006. This is well below the typical p level of 0.05, which tells us that this is a statistically significant effect. The effect size is found in the final column, “Partial Eta Squared,” which can be interpreted as we learned to interpret R2. The effect size of .625 indicates that this is a very large effect.
381