15.3 Applying Correlation in Psychometrics
Psychometrics is the branch of statistics used in the development of tests and measures.
Psychometricians are the statisticians and psychologists who develop tests and measures.
Here’s an in-
Reliability
Test–
In Chapter 1, we defined a reliable measure as one that is consistent. For example, if we measure shyness, then a reliable measure leads to nearly the same score every time a person takes the shyness test. One particular type of reliability is test–
404

Another way to measure the reliability of a test is by assessing its internal consistency in order to verify that all the items were measuring the same idea (DeVellis, 1991). Initially, researchers measured internal consistency via “split-
Consider a 10-
MASTERING THE CONCEPT
15.6: Correlation is used to calculate reliability either through test–
Coefficient alpha, symbolized as α, is a commonly used estimate of a test or measure’s reliability and is calculated by taking the average of all possible split-
When developing a new scale or measure, how high should its reliability be? It would not be worth using a scale in research if the scale’s coefficient alpha is less than 0.80. However, if we are using a scale to make decisions about individuals—
Validity
In Chapter 1, we defined a valid measure as one that measures what it was designed or intended to measure. Many researchers consider validity to be the most important concept in the field of psychometrics (e.g., Nunnally & Bernstein, 1994). It can be a great deal more work to measure validity than reliability, however, so that work is not always done. In fact, it is quite possible to have a reliable test, one that measures a variable, such as shyness, consistently over time and is internally consistent but is still not valid. Just because the items on a test all measure the same thing doesn’t mean that they’re measuring what we want them to measure or what we think they are measuring.
MASTERING THE CONCEPT
15.7: Correlation is used to calculate validity, often by correlating a new measure with existing measures known to assess the variable of interest.

For example, Cosmopolitan magazine often has quizzes that claim to assess readers’ relationships with their boyfriends. If you’ve ever taken one of these quizzes, you might wonder whether some of the quiz items actually measure what the quiz suggests. One quiz, titled “Is He Devoted to You?,” asks “Be honest: Do you ever worry that he might cheat on you?” Does this item assess a man’s devotion or a woman’s jealousy? Another item asks: “When you introduced him to your closest friends, he said:” and then offers three options—
405
It takes a psychometrician who understands correlation to test the validity of such measures. Typically, a psychometrician finds other measures with which to correlate the new measure. For instance, a new scale to measure anxiety might be correlated with an existing measure known to be valid, or with physiological measures of anxiety such as heart rate. If the new anxiety measure correlates with other measures, this is evidence of its validity.
Here’s another example concerning validity. In a groundbreaking study on affirmative action in higher education, researchers studied the success of more than 35,000 black and white students who attended 1 of 28 highly selective universities (Bowen & Bok, 2000). When determining validity, it is important that we consider how we will operationalize the variable of interest—
In this study, the researchers first considered the obvious criteria to operationalize success: these students’ future graduate education and career achievement. Their findings debunked the myth that black graduates of such institutions did not achieve the successes of their white counterparts. The researchers then went a step further and assessed a success-
Next Steps
Partial Correlation
Partial correlation is a technique that quantifies the degree of association between two variables that remains when the correlations of these two variables with a third variable are mathematically eliminated.
The higher levels of community participation by black college graduates compared to white college graduates demonstrates why it takes more than just two correlated variables to understand a complicated world. Fortunately, correlation also provides a helpful way—
MASTERING THE CONCEPT
15.8: Partial correlation allows us to quantify the relation between two variables, controlling for the correlation of each of these variables with a third related variable.
Earlier in this chapter, we explored the absences and exam grades of a subsample of 10 students from one class. In the entire sample of 26 students, taken from several classes, we found a correlation of −0.44. Students with more absences tended to have a lower exam grade; students with fewer absences tended to have a higher exam grade. We also discussed the many possible third variables that might influence this association. Here’s another possibility: the completion of homework assignments. As expected, the correlation between the percentage of completed homework assignments and exam grades was 0.53. Students who completed a higher percentage of homework assignments tended to earn better grades; students who completed a lower percentage of homework assignments tended to earn poorer grades.
406
The introduction of this third variable also lets us ask about the correlation between the number of absences and the percentage of completed homework assignments. In fact, the correlation between number of absences and percentage of completed homework assignments was −0.51. Students who missed class more often tended to have completed a smaller percentage of homework assignments; students who missed class less often tended to have completed a larger percentage of homework assignments.
Partial correlation enables us to tease apart the relation between two variables when we suspect that there is a third variable at work. How is it done? First of all, we have to measure all three variables and make sure they are all scale variables. Then, we calculate a correlation coefficient that expresses the association between two variables, over and above the association of either of these variables with a third variable. We can let software do the number crunching if we understand that it is calculating a partial correlation by subtracting the influence of a third variable from the correlation coefficient.
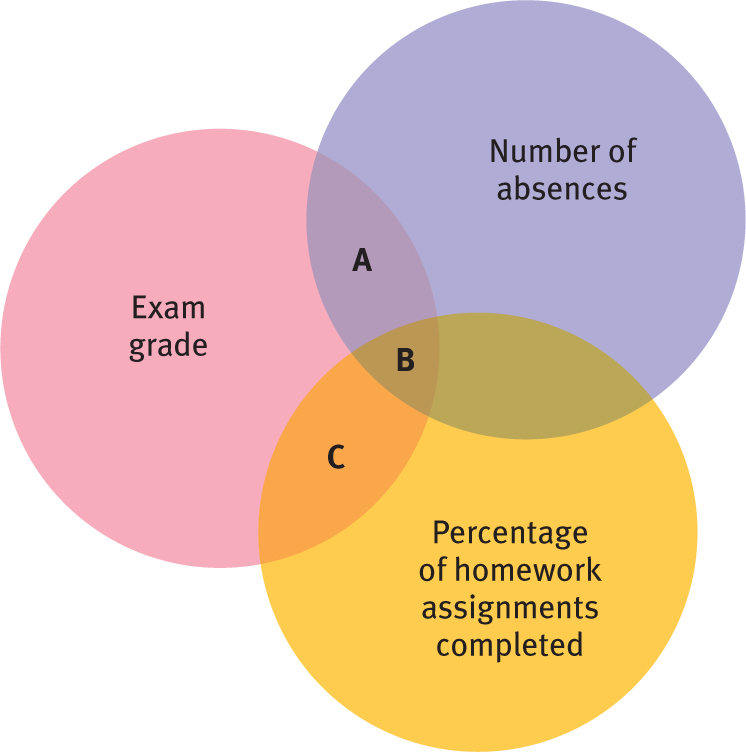
Figure 15-
The visual display in Figure 15-8 (called a Venn diagram) represents the three variables: number of absences, percentage of homework assignments completed, and exam grade. The circles overlap to the degree that the variables are associated. Each pair of variables is correlated to the degree to which the two circles that represent them overlap in the diagram. There is a portion of the diagram that represents the association among all three variables—
Partial correlation quantifies the correlation between two variables by removing (or correcting for) all overlapping variability of each variable with the third. The idea is that we calculate a correlation of two variables, over and above each of their correlations with the third variable. That allows us to calculate the partial correlation of number of absences and grade, correcting for percentage of homework assignments completed.

Let’s describe this same idea visually. In the Venn diagram in Figure 15-8, we calculate the association represented by the letter A—
We also can calculate the partial correlation of percentage of homework assignments and grade, correcting for number of absences. To do this, we calculate the association represented by C in the Venn diagram—
It appears that the variables of “number of absences” and “percentage of homework assignments completed” both have substantial correlations, independent of each other, with the variable of “exam grade.” We can think of it this way: First, for any particular specific number of absences, there is a correlation between homework and grade. Second, for any particular number of completed homework assignments, there is a correlation between absences and grade, although it is not as strong as the first partial correlation (between homework and grade).
407
What’s the message for the students in this class? Coming to class is associated with good exam grades, no matter how many of your homework assignments you complete. And doing homework is even more strongly associated with good exam grades, no matter how often you come to class. We can’t know that these behaviors cause good exam grades (correlation can never tell us about causality), but these data do suggest that students who come to class and do their homework tend to get the best exam grades.
CHECK YOUR LEARNING
Reviewing the Concepts
- Correlation is a central part of psychometrics, the statistics of the construction of tests and measures.
- Psychometricians, the statisticians who practice psychometrics, use correlation to establish the reliability and the validity of a test.
- Test–
retest reliability can be estimated by correlating the same participants’ scores on the same test at two different time points. - Coefficient alpha, now widely used to establish reliability, is essentially calculated by taking the average of all possible split-
half correlations (i.e., not just the odds vs. the evens). - Partial correlation lets us quantify the association between two variables, over and above the association of a third variable with either of these variables.
Clarifying the Concepts
- 15-
11 How does the field of psychometrics make use of correlation? - 15-
12 What does coefficient alpha measure and how is it calculated?
Calculating the Statistics
- 15-
13 A researcher is assessing a diagnostic tool for determining whether students should be placed in a remedial reading program. The researcher calculates coefficient alpha and finds that it is 0.85. - Does the test have sufficient reliability to be used as a diagnostic tool? Why or why not?
- Does the test have sufficient validity to be used as a diagnostic tool? Why or why not?
- What information would we need to appropriately assess the validity of the test?
- 15-
14 Imagine that the correlation between first- semester GPA in college and SAT scores is 0.76. Additionally, imagine that the partial correlation between first- semester GPA and SAT scores, controlling for high school GPA, is 0.20. What does the change from a correlation of 0.76 to a partial correlation of 0.20 mean for the relation between college GPA and SAT scores?
Applying the Concepts
- 15-
15 Remember the Cosmopolitan devotion quiz we referred to when discussing validity? Imagine that the magazine hired a psychometrician to assess the reliability and validity of its quizzes, and she administered this 10- item quiz to 100 female readers of that magazine who had boyfriends. - How could the psychometrician establish the reliability of the quiz? That is, which of the methods introduced in this chapter could she use in this case? Be specific, and cite at least two ways.
- How could the psychometrician establish the validity of the quiz? Be specific, and cite at least two ways.
- Choose one of your criteria from part (b) and explain why it might not actually measure the underlying variable of interest. That is, explain how your criterion itself might not be valid.
Solutions to these Check Your Learning questions can be found in Appendix D.
408