Chapter 18 How it Works
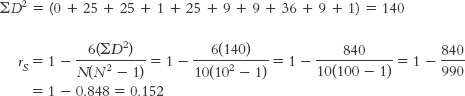
18.1 Calculating The Spearman Rank-Order Correlation Coefficient
The accompanying table includes ranks for accomplishment-
516
First, we have to convert the numbers of Olympic medals to ranks. Then we can calculate the correlation coefficient.
| Country | Pride Rank | Olympic Medals | Medals Rank | Difference (D) | Squared Difference (D2) |
|---|---|---|---|---|---|
| United States | 1 | 97 | 1 | 0 | 0 |
| South Africa | 2 | 5 | 7 | −5 | 25 |
| Austria | 3 | 3 | 8 | −5 | 25 |
| Canada | 4 | 14 | 5 | −1 | 1 |
| Chile | 5 | 1 | 10 | −5 | 25 |
| Japan | 6 | 18 | 3 | 3 | 9 |
| Hungary | 7 | 17 | 4 | 3 | 9 |
| France | 8 | 38 | 2 | 6 | 36 |
| Norway | 9 | 10 | 6 | 3 | 9 |
| Slovenia | 10 | 2 | 9 | 1 | 1 |
18.2 Conducting The Mann–
The Mann-
| 1 | Harvard University (E) |
| 2 | Princeton University (E) |
| 3.5 | University of Michigan, Ann Arbor (M) |
| 3.5 | Yale University (E) |
| 5 | Columbia University (E) |
| 6 | Massachusetts Institute of Technology (E) |
| 7 | Duke University (E) |
| 8 | University of Chicago (M) |
| 9.5 | University of North Carolina, Chapel Hill (E) |
| 9.5 | Washington University in St. Louis (M) |
| 12.5 | New York University (E) |
| 12.5 | The Ohio State University (M) |
| 12.5 | University of Rochester (E) |
| 12.5 | University of Wisconsin, Madison (M) |
| 15.5 | Cornell University (E) |
| 15.5 | University of Minnesota, Twin Cities (M) |
| 17 | Northwestern University (M) |
| 18 | University of Illinois, Urbana- |
517
How can we conduct a Mann–
- This study meets the first and third of the three assumptions: (1) There are ordinal data after we convert the data from scale to ordinal. (2) The researchers did not use random selection, so the ability to generalize beyond this sample is limited. (3)There are some ties, but we will assume that there are not so many as to render the results of the test invalid.
- Null hypothesis: Political science programs on the East Coast and those in the Midwest do not differ in national ranking. Research hypothesis: Political science programs on the East Coast and those in the Midwest differ in national ranking.
- There are 10 top political science programs on the East Coast and 8 in the Midwest.
- The cutoff, or critical value, for a Mann–
Whitney U test with one group of 10 programs and one group of 8 programs, a p level of 0.05, and a two- tailed test is 17. School Rank East Coast Rank Midwest Rank Harvard University 1 1 Princeton University 2 2 University of Michigan, Ann Arbor 3.5 3.5 Yale University 3.5 3.5 Columbia University 5 5 Massachusetts Institute of Technology 6 6 Duke University 7 7 University of Chicago 8 8 University of North Carolina, Chapel Hill 9.5 9.5 Washington University in St. Louis 9.5 9.5 New York University 12.5 12.5 The Ohio State University 12.5 12.5 University of Rochester 12.5 12.5 University of Wisconsin, Madison 12.5 12.5 Cornell University 15.5 15.5 University of Minnesota, Twin Cities 15.5 15.5 Northwestern University 17 17 University of Illinois, Urbana- Champaign 18 18 Before we continue, we sum the ranks for each group and add subscripts to indicate which group is which:
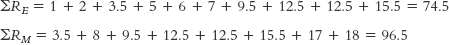
The formula for the first group is:

The formula for the second group is:

- For a Mann–
Whitney U test, we compare only the smaller test statistic, 19.5, with the critical value, 17. This test statistic is not smaller than the critical value, so we fail to reject the null hypothesis. We cannot conclude that the two groups are different with respect to national rankings. In a journal article, the statistics would read:
U = 19.5, p > 0.05
518