Chapter 9 How it Works
9.1 CONDUCTING A SINGLE-
In How It Works 7.2, we conducted a z test for data from the Consideration of Future Consequences (CFC) scale (Adams, 2012). How can we conduct all six steps of hypothesis testing for a single-
- Population 1: All students in career discussion groups. Population 2: All students who did not participate in career discussion groups.
The comparison distribution will be a distribution of means. The hypothesis test will be a single-
sample t test because we have only one sample and we know the population mean, but we do not know the population standard deviation. This study meets two of the three assumptions and may meet the third. The dependent variable is scale. In addition, there are more than 30 participants in the sample, indicating that the comparison distribution will be normal. The data were not randomly selected, however, so we must be cautious when generalizing. - Null hypothesis: Students who participated in career discussion groups had the same CFC scores, on average, as students who did not participate—
H0: μ1 = μ2. Research hypothesis: Students who participated in career discussion groups had different CFC scores, on average, than students who did not participate— H1: μ1 ≠ μ2. 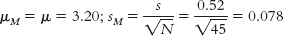
- df = N − 1 = 45 − 1 = 44
The critical values, based on 44 degrees of freedom (because 44 is not in the table, we look up the more conservative degrees of freedom of 40), a p level of 0.05, and a two-
tailed test, are −2.021 and +2.021. 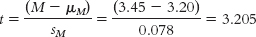
- Reject the null hypothesis. It appears that students who participate in career discussion groups have higher CFC scores, on average, than do students who do not participate.
The statistics, as presented in a journal article, would read:
t(44) = 3.21, p < 0.05
(Note: If we had used software, we would report the actual p value instead of just whether the p value is larger or smaller than the critical p value.)