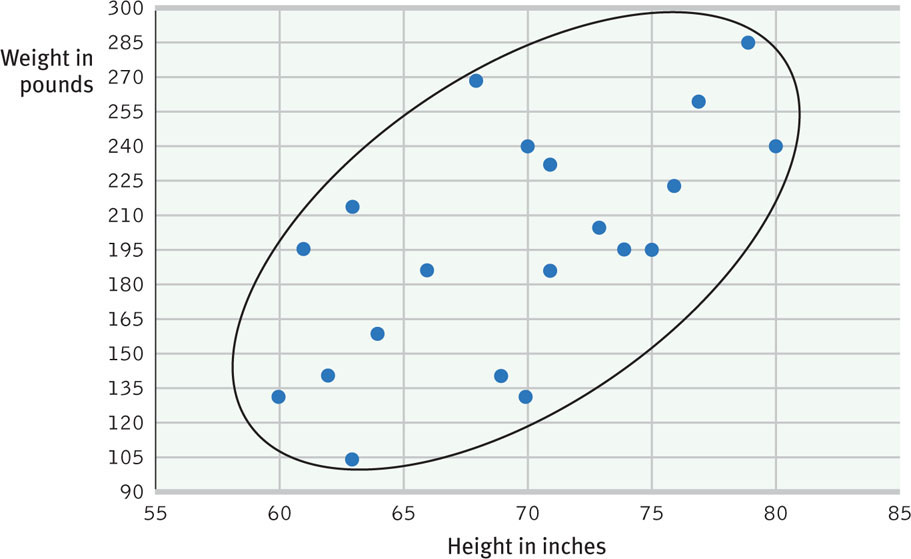
FIGURE 1.3 Scatterplot for height and weight
This graph displays data from 20 imagined people, each represented by a data point. The scattered points reveal an upward slope, indicating a positive correlation.