8.3 Intelligence
School boards, courts, and scientists debate the use and fairness of tests that assess people’s mental abilities and assign them a score. One of psychology’s most heated questions has been whether each of us has some general mental capacity that can be measured and expressed as a number.
In this section, we consider some findings from more than a century of research, as psychologists have searched for answers to these questions and more:
238
What is intelligence? Is it one general ability, or many different abilities?
How can we best assess intelligence?
How do nature (heredity) and nurture (environment) together weave the fabric of intelligence?
What intelligence test score similarities and differences exist among groups, and what accounts for those differences?
What Is Intelligence?
LOQ 8-
intelligence the ability to learn from experience, solve problems, and use knowledge to adapt to new situations.
Intelligence is not a quality like height or weight, which has the same meaning in all generations, worldwide. People assign the term intelligence to the qualities that enable success in their own time and place (Sternberg & Kaufman, 1998). In Cameroon’s equatorial forest, intelligence may be understanding the medicinal qualities of local plants. In a North American high school, it may be mastering difficult concepts in tough courses. In both places, intelligence is the ability to learn from experience, solve problems, and use knowledge to adapt to new situations.
You probably know some people with talents in science or history, and others gifted in athletics, art, music, or dance. You may also know a terrific artist who is stumped by the simplest math problem, or a brilliant math student with little talent for writing term papers. Are all these people intelligent? Could you rate their intelligence on a single scale? Or would you need several different scales? Simply put: Is intelligence a single overall ability or several specific abilities?
Spearman’s General Intelligence (g)
general intelligence (g) a general intelligence factor that, according to Spearman and others, underlies specific mental abilities and is therefore measured by every task on an intelligence test.
Charles Spearman (1863–
In Spearman’s view, mental abilities are much like physical abilities. The ability to run fast is distinct from the eye-
Theories of Multiple Intelligences
LOQ 8-
Other psychologists, particularly since the mid-
savant syndrome a condition in which a person otherwise limited in mental ability has an exceptional specific skill, such as in computation or drawing.
GARDNER’S MULTIPLE INTELLIGENCES Howard Gardner (1983, 2006, 2011; Davis et al., 2011) views intelligence as multiple abilities that come in different packages. Brain damage, he notes, may destroy one ability but leave others intact. He sees other evidence of multiple intelligences in people with savant syndrome. Despite their island of brilliance, these people often score low on intelligence tests and may have limited or no language ability (Treffert & Wallace, 2002). Some can render incredible works of art or music. Others can compute numbers with amazing speed and accuracy, or identify almost instantly the day of the week that matches any given date in history (Miller, 1999).

About four in five people with savant syndrome are males. Many also have autism spectrum disorder (ASD), a developmental disorder. The late memory whiz Kim Peek (who did not have ASD) inspired the movie Rain Man. In 8 to 10 seconds, Peek could read and remember a page. During his lifetime, he memorized 9000 books, including Shakespeare’s plays and the Bible. He absorbed details of maps and could provide GPS-
239
Gardner has identified a total of eight relatively independent intelligences, including the verbal and mathematical aptitudes assessed by standardized tests (FIGURE 8.8). (He has also proposed a ninth possibility—

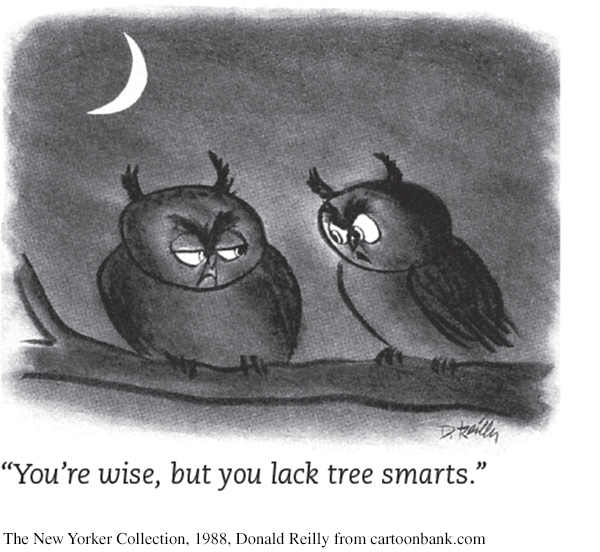
“You have to be careful, if you’re good at something, to make sure you don’t think you’re good at other things that you aren’t necessarily so good at. . . . Because I’ve been very successful at [software development] people come in and expect that I have wisdom about topics that I don’t.”
Bill Gates, 1998
STERNBERG’S THREE INTELLIGENCES Robert Sternberg (1985, 2011) agrees with Gardner that there is more to real-
Analytical intelligence (school smarts: traditional academic problem solving)
Creative intelligence (trailblazing smarts: the ability to adapt to new situations and generate novel ideas)
Practical intelligence (street smarts: skill at handling everyday tasks that may be poorly defined, with multiple solutions)
Gardner and Sternberg differ in some areas, but they agree on two important points: Multiple abilities can contribute to life success, and varieties of giftedness bring spice to life and challenges for education. Trained to appreciate such variety, many teachers have applied multiple intelligence theories in their classrooms.
240
CRITICISMS OF MULTIPLE INTELLIGENCE THEORIES Wouldn’t it be wonderful if the world were so just that a weakness in one area would be balanced by genius in another? Alas, say critics, the world is not just (Ferguson, 2009; Scarr, 1989). Research using factor analysis has confirmed that there is a general intelligence factor: g matters (Johnson et al., 2008). It predicts performance on various complex tasks and in various jobs (Arneson et al., 2011; Gottfredson, 2002a,b, 2003a,b). Youths’ intelligence test scores predict their income decades later (Zagorsky, 2007).
But we do well to remember that the recipe for success is not simple. As in so many realms of life, success has two ingredients: can do (ability) and will do (motivation) (Lubinski, 2009a). High intelligence may get you into a profession (via the schools and training programs that open doors). Grit—your motivation and drive—
Highly successful people tend to be conscientious, well connected, and doggedly energetic. These qualities often translate into dedicated hard work. Researchers report a 10-
Retrieve + Remember
Question 8.9
•How does the existence of savant syndrome support Gardner’s theory of multiple intelligences?
ANSWER: People with savant syndrome have limited mental ability overall but possess one or more exceptional skills. According to Howard Gardner, this suggests that our abilities come in separate packages rather than being fully expressed by one general intelligence that covers all our talents.
Emotional Intelligence
LOQ 8-
Some psychologists have further explored our nonacademic social intelligence—the know-
emotional intelligence the ability to perceive, understand, manage, and use emotions.
A critical part of social intelligence, emotional intelligence, includes four abilities (Mayer et al., 2002, 2011, 2012):
Perceiving emotions (recognizing them in faces, music, and stories)
Understanding emotions (predicting them and how they may change and blend)
Managing emotions (knowing how to express them in varied situations)
Using emotions to enable adaptive or creative thinking
Emotionally intelligent people are both socially aware and self-
Those who score high on managing emotions enjoy higher-
* * *
TABLE 8.3 summarizes these theories of intelligence.
| Theory | Summary | Strengths | Other Considerations |
|---|---|---|---|
| Spearman’s general intelligence (g) | A basic intelligence predicts our abilities in many different academic areas. | Different abilities, such as verbal and spatial, do have some tendency to correlate. | Human abilities are too varied to be presented as a single general intelligence factor. |
| Gardner’s multiple intelligences | Our abilities are best classified into eight or nine independent intelligences, which include a broad range of skills beyond traditional school smarts. | Intelligence is more than just verbal and mathematical skills. Other equally important abilities help us adapt. | Should all abilities be considered intelligences? Shouldn’t some be called less vital talents? |
| Sternberg’s triarchic theory | Our intelligence is best classified into three areas that predict real- |
These three areas cover the different aptitudes we call intelligence. | These three areas may be less independent than Sternberg thought and may actually share an underlying g factor. |
| Emotional intelligence | Social intelligence contributes to life success. Emotional intelligence is a key aspect, consisting of perceiving, understanding, managing, and using emotions. | The four components that predict social success. | Does this stretch the concept of intelligence too far? |
Assessing Intelligence
LOQ 8-
intelligence test a method for assessing an individual’s mental aptitudes and comparing them with those of others, using numerical scores.
An intelligence test assesses a person’s mental aptitudes and compares them with those of others, using numerical scores. We can test people’s mental abilities in two ways, depending on what we want to know.
achievement test a test designed to assess what a person has learned.
Achievement tests are designed to measure what people have learned. Your final exam will measure what you learned in this class.
aptitude test a test designed to predict a person’s future performance; aptitude is the capacity to learn.
Aptitude tests are designed to assess what people will be able to learn; they are meant to predict future behavior.
So, how do psychologists design these tests, and why should we believe in the results?
What Do Intelligence Tests Test?
LOQ 8-
Barely more than a century ago, psychologists began designing tests to assess people’s mental abilities. Modern intelligence testing traces its birth to early twentieth-
241
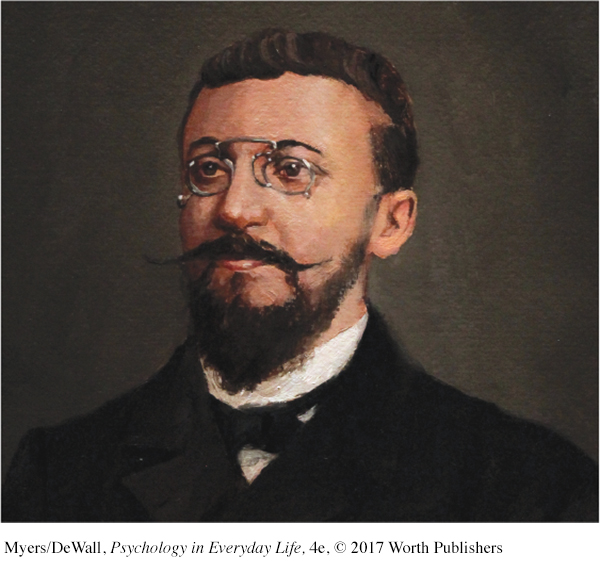
ALFRED BINET: PREDICTING SCHOOL ACHIEVEMENT With a new French law that required all children to attend school, officials knew that some children, including many newcomers to Paris, would need special classes. But how could the schools make fair judgments about children’s learning potential? Teachers might assess children who had little prior education as slow learners. Or they might sort children into classes on the basis of their social backgrounds. To avoid such bias, France’s minister of public education gave psychologist Alfred Binet the task of designing fair tests.
mental age a measure of intelligence test performance devised by Binet; the level of performance typically associated with children of a certain chronological age. Thus, a child who does as well as an average 8-
In 1905, Binet and his student, Théodore Simon, first presented their work (Nicolas & Levine, 2012). They began by assuming that all children follow the same course of intellectual development but that some develop more rapidly. A “dull” child should therefore score much like a typical younger child, and a “bright” child like a typical older child. Binet and Simon now had a clear goal. They would measure each child’s mental age, the level of performance typically associated with a certain chronological age (age in years). Average 8-
Binet and Simon tested a variety of reasoning and problem-
Binet hoped his test would be used to improve children’s education. But he also feared it would be used to label children and limit their opportunities (Gould, 1981).
Stanford-
LEWIS TERMAN: MEASURING INNATE INTELLIGENCE Binet’s fears were realized soon after his death in 1911, when others adapted his tests for use as a numerical measure of inherited intelligence. Lewis Terman (1877–
242
Terman assumed that intelligence tests revealed a fixed mental capacity present from birth. He also assumed that some ethnic groups were naturally more intelligent than others. And he supported the controversial eugenics movement, which promoted selective breeding and sterilization as a means of protecting and improving human genetic quality.
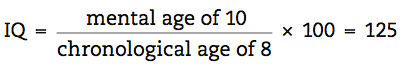
intelligence quotient (IQ) defined originally as the ratio of mental age (ma) to chronological age (ca) multiplied by 100 (thus, IQ = ma ÷ ca × 100). On contemporary intelligence tests, the average performance for a given age is assigned a score of 100.
German psychologist William Stern’s contribution to intelligence testing was the famous term intelligence quotient, or IQ. The IQ was simply a person’s mental age divided by chronological age and multiplied by 100 to get rid of the decimal point. Thus, an average child, whose mental age (8) and chronological age (8) are the same, has an IQ of 100. But an 8-
The original IQ formula worked fairly well for children but not for adults. (Should a 40-
Wechsler Adult Intelligence Scale (WAIS) the WAIS and its companion versions for children are the most widely used intelligence tests; contains verbal and performance (nonverbal) subtests.
DAVID WECHSLER: TESTING SEPARATE STRENGTHS Psychologist David Wechsler created what is now the most widely used individual intelligence test, the Wechsler Adult Intelligence Scale (WAIS). There is a version for school-
Similarities—Considering the commonality of two objects or concepts, such as “In what way are wool and cotton alike?”
Vocabulary—Naming pictured objects, or defining words (“What is a guitar?”)
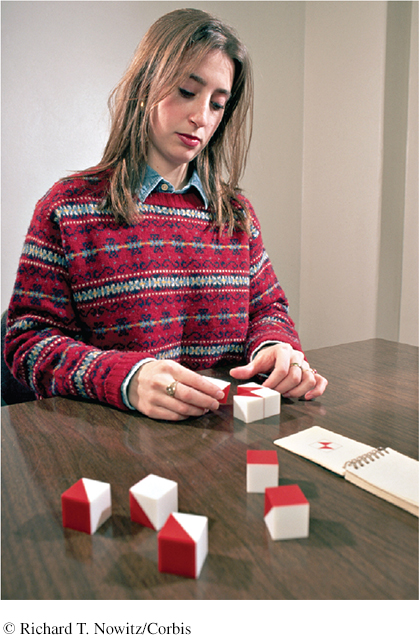
Block design—Visual abstract processing, such as “Using the four blocks, make one just like this.”
Letter-
number sequencing—On hearing a series of numbers and letters, repeat the numbers in ascending order, and then the letters in alphabetical order: “R- 2- C- 1- M- 3.”
The WAIS yields both an overall intelligence score and separate scores for verbal comprehension, perceptual organization, working memory, and processing speed. Striking differences among these scores can provide clues to strengths or weaknesses. For example, a person who scores low on verbal comprehension but has high scores on other subtests may have a reading or language disability. Other comparisons can help health care workers design a therapy plan for a stroke patient. In such ways, these tests help realize Binet’s aim: to identify opportunities for improvement and strengths that teachers and others can build upon.
Retrieve + Remember
Question 8.10
•An employer with a pool of applicants for a single position wants to know each applicant’s potential. To determine that, she should use an _________________ (achievement/aptitude) test. That same employer wishing to test the effectiveness of a new, on-
ANSWERS: aptitude; achievement
Question 8.11
•What did Binet hope to achieve by establishing a child’s mental age?
ANSWER: Binet hoped that knowing the child’s mental age (the age that typically corresponds to a certain level of performance) would help identify appropriate school placement.
Question 8.12
•What is the IQ of a 4-
ANSWER: 125 (5 ÷ 4 × 100 = 125)
Three Tests of a “Good” Test
LOQ 8-
To be widely accepted, a psychological test must be standardized, reliable, and valid. The Stanford-
standardization defining uniform testing procedures and meaningful scores by comparison with the performance of a pretested group.
WAS THE TEST STANDARDIZED? The number of questions you answer correctly on an intelligence test would reveal almost nothing. To know how well you performed, you would need some basis for comparison. That’s why test-
243
normal curve the bell-
One way to compare scores is to graph them. No matter what trait we measure—
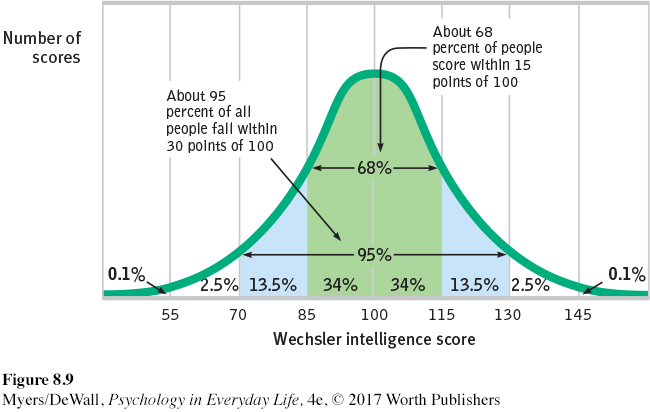
On an intelligence test, the average score has a value of 100 (FIGURE 8.9). For the Stanford-
reliability the extent to which a test yields consistent results, as assessed by the consistency of scores on two halves of the test, on alternative forms of the test, or on retesting.
IS THE TEST RELIABLE? Knowing how your score compares with those in the standardization group still won’t tell you much unless the test has reliability. A reliable test gives consistent scores, no matter who takes the test or when they take it. To check a test’s reliability, researchers test many people many times. They may retest people using the same test, or they may split the test in half and see whether odd-
The tests we have considered—
validity the extent to which a test measures or predicts what it is supposed to. (See also content validity and predictive validity.)
IS THE TEST VALID? A valid test measures or predicts what it promises. A test can be reliable but not valid. Imagine buying a tape measure with faulty markings. If you use it to measure people’s heights, your results will be very reliable. No matter how many times you measure, people’s heights will be the same. But your faulty height results will not be valid.
content validity the extent to which a test samples the behavior that is of interest.
predictive validity the success with which a test predicts the behavior it is designed to predict.
 See LaunchPad’s Video: Correlational Studies for a helpful tutorial animation.
Valid tests have content validity when they measure what they are supposed to measure. The road test for a driver’s license has content validity because it samples the tasks a driver routinely faces. A course exam has content validity if it tests what you learned in the course. But we also expect intelligence tests to have predictive validity. Intelligence tests should predict future performance, and to some extent, they do.
High and Low Scorers—How Do They Differ?
LOQ 8-
One way to glimpse the validity and significance of any test is to compare people who score at the two extremes of the normal curve. As FIGURE 8.9 shows, about 5 percent of intelligence test-
244
intellectual disability a condition of limited mental ability, indicated by an intelligence test score of 70 or below and difficulty adapting to the demands of life. (Formerly referred to as mental retardation.)
Down syndrome a condition of mild to severe intellectual disability and associated physical disorders caused by an extra copy of chromosome 21.
THE LOW EXTREME A low intelligence test score alone does not mean that a person has the developmental condition now known as an intellectual disability (formerly called mental retardation). Intellectual disability is a condition that is apparent before age 18. It sometimes has a known physical cause. Down syndrome, for example, is a disorder of varying intellectual and physical severity caused by an extra copy of chromosome 21. People diagnosed with a mild intellectual disability—
The American Association on Intellectual and Developmental Disabilities guidelines list two requirements for assigning a diagnosis of intellectual disability:
The person’s intelligence test score indicates performance below 98 percent of test-
takers (Schalock et al., 2010). 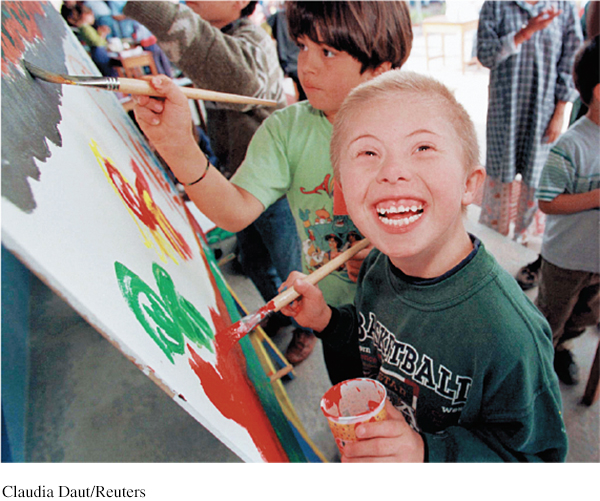 MAINSTREAMING IN CHILE Most Chilean children with Down syndrome attend separate schools for students with special needs. However, this boy attends the Altamira School, where children with differing abilities share the classroom.Claudia Daut/Reuters
The person has difficulty adapting to the normal demands of independent living, as expressed in three areas, or skills: conceptual (such as language, reading, and concepts of money, time, and number); social (such as interpersonal skills, being socially responsible, following basic rules and laws, avoiding being victimized); and practical (such as health and personal care, occupational skill, and travel).
THE HIGH EXTREME Children whose intelligence test scores indicate extraordinary academic gifts mostly thrive. In one famous project begun in 1921, Lewis Terman studied more than 1500 California schoolchildren with IQ scores over 135. These high-
Other studies have focused on young people who aced the SAT. One group of 1650 math whizzes had at age 13 scored in the top quarter of 1 percent of their age group. By their fifties, those individuals had claimed 681 patents (Lubinski et al., 2014). Another group of 13-
Jean Piaget, the twentieth century’s most famous developmental psychologist, might have felt right at home with these whiz kids. By age 15, he was already publishing scientific articles on mollusks (Hunt, 1993).
Retrieve + Remember
Question 8.13
•What are the three requirements that a psychological test must meet in order to be widely accepted? Explain.
ANSWER: A psychological test must be standardized (pretested on a representative sample of people), reliable (yielding consistent results), and valid (measuring and predicting what it is supposed to).
The Nature and Nurture of Intelligence
Intelligence runs in families. But why? Are our intellectual abilities mostly inherited? Or are they molded by our environment?
Heredity and Intelligence
LOQ 8-
heritability the portion of variation among people in a group that we can attribute to genes. The heritability of a trait may vary, depending on the population and the environment.
Heritability is the portion of the variation among individuals that we can assign to genes. Estimates of the heritability of intelligence range from 50 to 80 percent (Calvin et al., 2012; Johnson et al., 2009; Neisser et al., 1996). Does this mean that we can assume that 50 percent of your intelligence is due to your genes, and the rest to your environment? No. Heritability is a tricky concept. The important point to remember: Heritability never applies to an individual, only to why people in a group differ from one another.
245
The heritability of intelligence varies from study to study. To see why, consider humorist Mark Twain’s fantasy of raising boys in barrels until age 12, feeding them through a hole. Let’s take his joke a step further and say we’ll give all those boys an intelligence test at age 12. Since their environments were all equal, any differences in their test scores could only be due to their heredity. In this “study,” heritability would be 100 percent. But what if a mad scientist cloned 100 boys and raised them in drastically different environments (some in barrels and others in mansions)? In this case, their heredity would be equal, so any test-
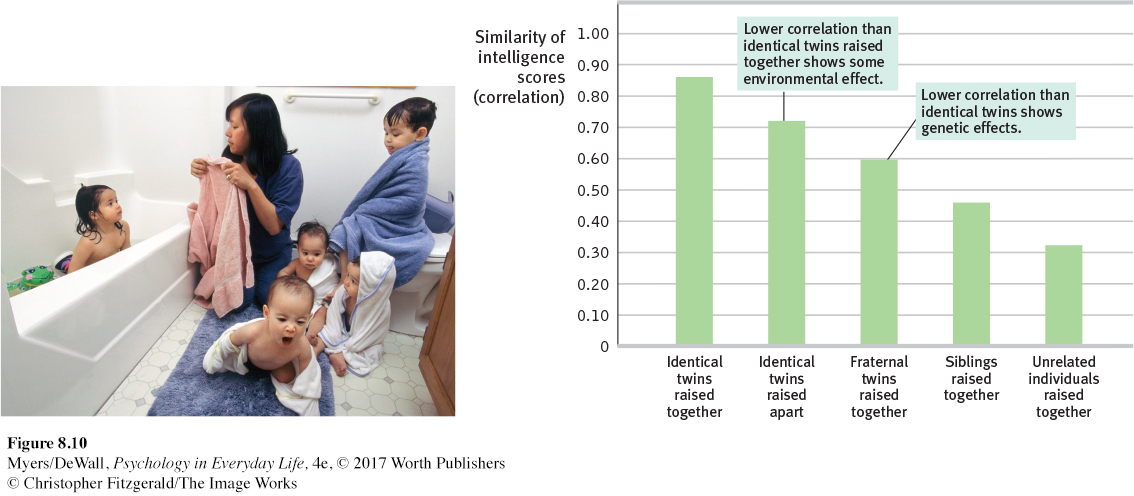
In real life, psychologists can’t clone people to study the effects of heredity and environment. But as we noted in Chapter 3, nature has done that work for us. Identical twins share the same genes. Do they also share the same mental abilities? As you can see from FIGURE 8.10, which summarizes many studies, the answer is Yes. Even when identical twins are adopted by two different families, their intelligence test scores are nearly the same. When they grow up together, their scores are nearly as similar as those of one person taking the same test twice (Haworth et al., 2009; Lykken, 1999; Plomin et al., 2016). Identical twins are also very similar in specific talents, such as music, math, and sports (Vinkhuyzen et al., 2009).
Although genes matter, there is no known “genius” gene. When 200 researchers pooled their data on 126,559 people, all the gene variations analyzed accounted for only about 2 percent of the differences in educational achievement (Rietveld et al., 2013). The search for smart genes continues, but this much is clear: Many, many genes contribute to intelligence (Bouchard, 2014). Intelligence is thus like height (Johnson, 2010). Working together, 54 specific gene variations account for only 5 percent of our individual height differences.
Retrieve + Remember
Question 8.14
•A check on your understanding of heritability: If environments become more equal, the heritability of intelligence would
increase.
decrease.
be unchanged.
ANSWER: a. (Heritability—
Environment and Intelligence
246
Fraternal twins are genetically no more alike than any other two siblings. But they usually share an environment and, because they are the same age, are often treated more alike. So are their intelligence test scores more alike than those of other siblings? Yes—
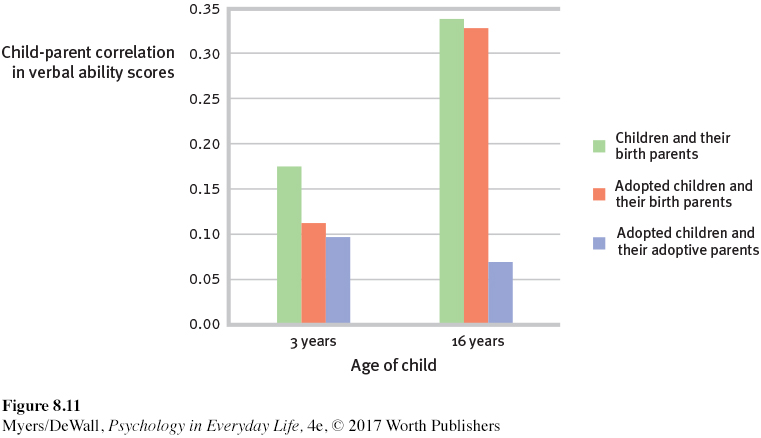
Adoption studies also help us assess the influence of environment on intelligence. Seeking to untangle the effects of genes and environment, researchers have compared the intelligence test scores of adopted children with those of their
biological parents (who provided their genes).
adoptive parents (who provided their home environment).
adoptive siblings (who shared that home environment).
Several studies suggest that a shared environment exerts a modest influence on intelligence test scores.
The intelligence scores of “virtual twins”—same-
age children adopted as infants and raised together as siblings— correlate at a level higher than chance: +0.28 (Segal et al., 2012). Adoption from poverty into middle-
class homes enhances children’s intelligence test scores (Nisbett et al., 2012). One large Swedish study looked at this effect among children adopted into wealthier families with more educated parents. The adopted children’s scores were higher, by an average of 4.4 points, than those of their not- adopted biological siblings (Kendler et al., 2015). Adoption of mistreated or neglected children also enhances their intelligence scores (van IJzendoorn & Juffer, 2005, 2006).
So during childhood, adoptive siblings’ test scores correlate modestly. What do you think happens as the years go by and adopted children settle in with their adoptive families? Would you expect the shared-
See LaunchPad’s Video: Twin Studies for a helpful tutorial animation.
If you said Yes, we have a surprise for you. Mental similarities between adopted children and their adoptive families lessen with age. By adulthood they drop to roughly zero (McGue et al., 1993). Genetic influences—
Gene-Environment Interactions
LOQ 8-
We have seen that biology and experience intertwine. (Recall from Chapter 3 that epigenetics is the field that studies this nature–
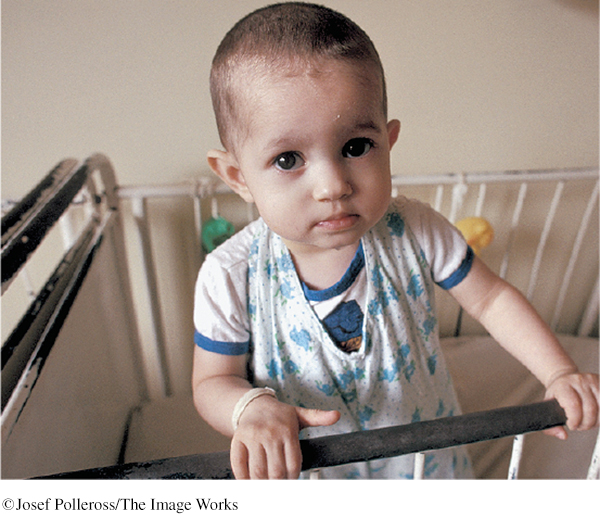
Sometimes, however, environmental conditions work in reverse, depressing cognitive development. Severe deprivation leaves footprints on the brain, as J. McVicker Hunt (1982) observed in one Iranian orphanage. The typical child Hunt observed there could not sit up unassisted at age 2 or walk at age 4. The little care the infants received was not in response to their crying, cooing, or other behaviors, so the children developed little sense of personal control over their environment. They were instead becoming passive “glum lumps.” Extreme deprivation was crushing native intelligence—
247
Mindful of the effect of early experiences and early intervention, Hunt began a training program for the Iranian caregivers, teaching them to play language-
If extreme conditions—
Later in childhood, however, some forms of enrichment can pay intelligence-
So, environmental influences can foster or diminish cognitive skills. But what is the general trend? On our journey from womb to tomb, does our intelligence change or remain stable?
Intelligence Across the Life Span
Stability or Change?
LOQ 8-
Intelligence endures. By age 4, children’s intelligence test scores begin to predict their adolescent and adult scores. By late adolescence, intelligence and other aptitude scores display remarkable stability. How do we know this?
cross-
Cross-
sectional studies compare people of different ages with one another. longitudinal study research in which the same people are restudied and retested over a long period.
Longitudinal studies restudy and retest the same people over a long period of time.
Scottish researcher Ian Deary and his colleagues (2004, 2009b, 2013) set a record for a long-
On June 1, 1997, sixty-
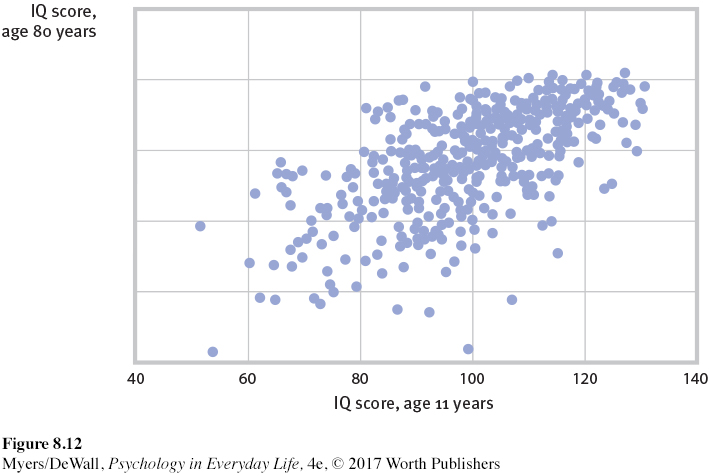
Higher-
See LaunchPad’s Video: Longitudinal and Cross-
Intelligence gives people better access to more education, better jobs, and a healthier environment.
Intelligence encourages healthy living: less smoking, better diet, more exercise.
Prenatal events or early childhood illnesses could influence both intelligence and health.
A “well-
wired body,” as evidenced by fast reaction speeds, may foster both intelligence and longer life.
So, intelligence scores are strikingly stable. And high intelligence is a predictor of health and long life. Yet, with age, our knowledge and our mental agility change, as we see next.
248
Crystallized and Fluid Intelligence
LOQ 8-
What happens to our intellectual powers as we age? The answer to that question depends on the task and the type of ability it represents.
crystallized intelligence your accumulated knowledge and verbal skills; tends to increase with age.
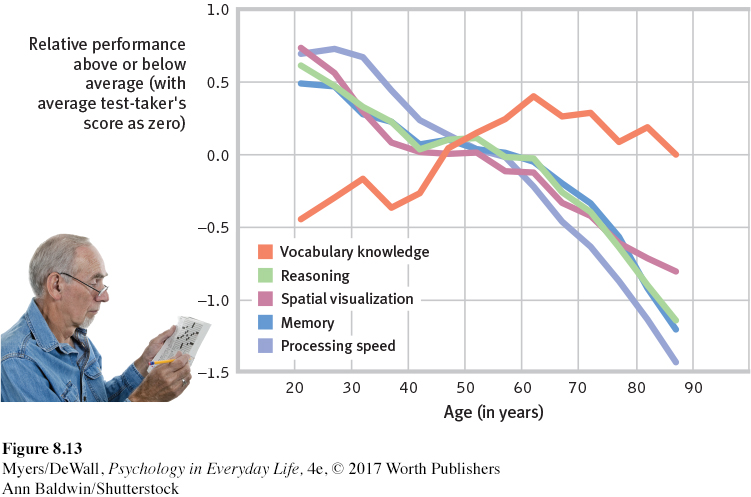
Crystallized intelligence—
our accumulated knowledge, as reflected in vocabulary and word- power tests— increases as we age, up to old age. fluid intelligence your ability to reason speedily and abstractly; tends to decrease with age, especially during late adulthood.
Fluid intelligence—
our ability to reason speedily and abstractly, as when solving unfamiliar logic problems— decreases beginning in the twenties and thirties. It declines slowly until about age 75 or so, and then more rapidly, especially after age 85 (Cattell, 1963; Horn, 1982; Salthouse, 2009, 2013).
With age we lose and we win. We lose recall memory and processing speed, but we gain vocabulary and knowledge (FIGURE 8.13). In older adulthood, our social reasoning skills increase. We are better able to see many different viewpoints, to appreciate the limits of knowledge, and to offer helpful wisdom in times of conflict (Grossmann et al., 2010). Our decisions also become less distorted by negative emotions such as anxiety, depression, or anger (Blanchard-
These life-
Retrieve + Remember
Question 8.15
•Researcher A is well funded to learn about how intelligence changes over the life span. Researcher B wants to study the intelligence of people who are now at various life stages. Which researcher should use the cross-
ANSWER: Researcher A should develop a longitudinal study to examine how intelligence changes in the same people over the life span. Researcher B should develop a cross-
Group Differences in Intelligence Test Scores
If there were no group differences in aptitude scores, psychologists would have no debate over hereditary and environmental influences. But there are group differences. What are they? And what do they mean?
Gender Similarities and Differences
LOQ 8-
As in everyday life, in science it is differences, not similarities, that excite interest. Compared with the many ways men and women are physically alike, our intelligence differences are minor. In the 1932 testing of all Scottish 11-
Yet, most people find differences more newsworthy. Girls outpace boys in spelling, verbal fluency, and locating objects (Voyer & Voyer, 2014). They are better emotion detectors and are more sensitive to touch, taste, and color (Halpern et al., 2007). In math computation and overall math performance, girls and boys hardly differ (Else-
Males’ mental ability scores also vary more than females’. Worldwide, boys outnumber girls at both the low extreme and the high extreme (Brunner et al., 2013). Boys, for example, are more often found in special education classes, but also among those scoring very high on the SAT math test.
249
The most reliable male edge appears in spatial ability tests like the one shown in FIGURE 8.14 (Maeda & Yoon, 2013; Wei et al., 2012). To solve the problem, you must quickly rotate three-
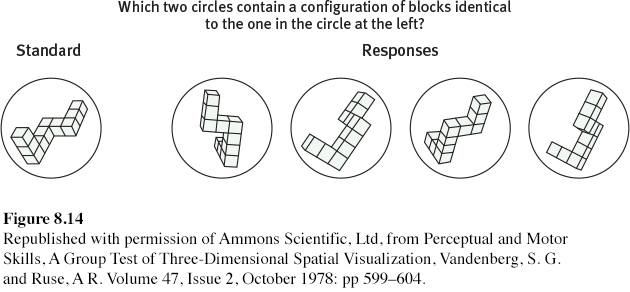
Question 8.16
ANSWER: The first and fourth responses.
But social expectations and opportunities also matter. In Russia, Asia, and the Middle East—

Racial and Ethnic Similarities and Differences
LOQ 8-
Fueling the group-
Racial and ethnic groups differ in their average intelligence test scores.
High-
scoring people (and groups) are more likely to achieve high levels of education and income.
250
There are many group differences in average intelligence test scores. New Zealanders of European descent outscore native Maori New Zealanders. Israeli Jews outscore Israeli Arabs. Most Japanese outscore most Burakumin, a stigmatized Japanese minority. And White Americans have outscored Black Americans. This Black-
One more agreed-
We have seen that heredity contributes to individual differences in intelligence. But group differences in a heritable trait may be entirely environmental, as in our earlier boys-

Might racial and ethnic gaps be similarly environmental? Consider:
Genetics research reveals that under the skin, we humans are remarkably alike. The average genetic difference between two Icelandic villagers or between two Kenyans greatly exceeds the group difference between Icelanders and Kenyans (Cavalli-
Race is not a neatly defined biological category. Many social scientists think race is no longer a meaningful term. They view race primarily as a social category without well-

Within the same population, there are generation-
251
Given the same information, Blacks and Whites show similar information-
Schools and culture matter. Countries whose economies create a large wealth gap between rich and poor also tend to have a large rich-
In different eras, different ethnic groups have experienced golden ages—
Retrieve + Remember
Question 8.17
•If our society were to change dramatically, so that it offered perfect environmental equality, would the heritability of intelligence test scores then be 100 percent, or zero?
ANSWER: Perfect environmental equality would create 100 percent heritability, because genes alone would account for any human differences.
Are Intelligence Test Questions Biased?
LOQ 8-
Knowing there are group differences in intelligence test scores leads us to wonder whether those differences are built into the tests. Are intelligence tests biased? The answer depends on how we define bias.
One way a test can be biased is if scores are influenced by a person’s cultural experience. This in fact happened to Eastern European immigrants in the early 1900s. Lacking the experience to answer questions about their new culture, many were classified as “feeble-
The scientific meaning of bias hinges on a test’s validity. A valid intelligence test should predict future behavior for all groups of test-
As you’ve seen in so many contexts in this text, expectations and attitudes influence perceptions and behaviors. For intelligence test-
stereotype threat a self-
STEREOTYPE THREAT If you worry that your group or “type” often doesn’t do well on a certain kind of test, your self-
In one study, equally capable men and women took a difficult math test. The women did not do as well as the men—
Stereotype threat helps explain why Blacks have scored higher when tested by Blacks than when tested by Whites (Danso & Esses, 2001; Inzlicht & Ben-
252
Could remedial “minority support” programs function as a stereotype that can erode performance? Some researchers believe they can, by giving students the message that they probably won’t succeed. College programs that challenge minority students to believe in their potential, to increase their sense of belonging, or to focus on the idea that intelligence is not fixed have had good results. Students’ grades were markedly higher, and their dropout rates lower (Walton & Cohen, 2011; Wilson, 2006).
Believing that intelligence is changeable, rather than biologically fixed, can foster a growth mind-
More than 300 studies of college and university students confirm the point. Ability + opportunity + motivation = success. High school students’ math achievements and college students’ grades reflect their aptitude but also their self-
Retrieve + Remember
Question 8.18
•What is the difference between a test that is biased culturally and a test that is biased in terms of its validity?
ANSWER: A test may be culturally biased if higher scores are achieved by those with certain cultural experiences. That same test may not be biased in terms of validity if it predicts what it is supposed to predict. For example, the SAT may be culturally biased in favor of those with experience in the U.S. school system, but it does still accurately predict U.S. college success.
Question 8.19
•What psychological principle helps explain why women tend to perform more poorly when they believe their online chess opponent is male?
ANSWER: stereotype threat
What time is it now? When you were reading about overconfidence, did you underestimate or overestimate how quickly you would finish the chapter?
* * *
Perhaps, then, these should be our goals for tests of mental abilities:
Realize the benefits Alfred Binet foresaw—to enable schools to recognize who might profit most from early intervention.
Remain alert to Binet’s fear—
that intelligence test scores may be misinterpreted as literal measures of a person’s enduring worth and potential. Remember that the competence that general intelligence tests sample is important. Without such tests, those who decide on jobs and admissions would rely more on other considerations, such as personal opinion. But these tests reflect only one aspect of personal competence. Our practical intelligence and emotional intelligence matter, too, as do other forms of creativity, talent, and character.
The point to remember: There are many ways of being successful: Our differences are variations of human adaptability. Life’s great achievements result not only from abilities (and fair opportunity) but also from motivation. Competence + Diligence = Accomplishment.