Chapter 14. Chapter 14: Population Ecology

Review & Rehearse

Review & Rehearse
true
true
You must read each slide, and complete any questions on the slide, in sequence.

Instructions

Review the visual summaries and answer the essay questions below.

Make sure to enter a brief response that completely answers each question and explains your reasoning. When you click "Submit," you will be provided instant feedback, allowing you to check if your response is correct.

(This activity contains 15 total essay questions. Each new question will be revealed once you complete the preceding question.)

Question 14.1

ZIXYwgK7eDObl+0L4gm9LGH2QanE/VXmkNTouZ6KFpXKnRKlar2U7vq/9Caa8HF4SLeBIVT/Cv76HYp9Xr2fhFeZYU3HzzcUP5CGd3p9+1Sh0iiEUUoPYQ+O683rvwbnRbXqJ3Vge9+y/QRp
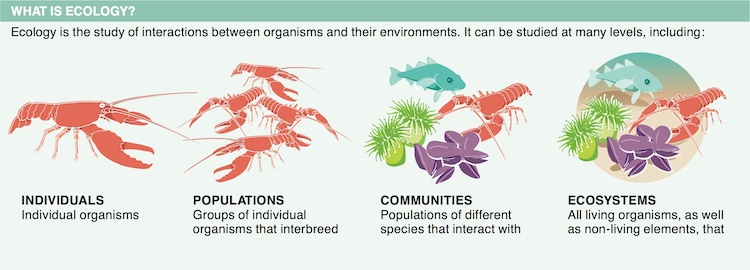
Population ecology is a subfield of ecology that studies the interactions of populations of species with their environment—specifically, study of the growth of a population and how other species and the environment influence that growth.

Question 14.2

aBzsdSShPMhmzZe4BtbpZS/c0X6RbHHGpZX2l9R84ElzRTH9CH4/9z9PyxQ8NuAr6mJz2k60AExCqt+yPBQr3qCkfO/NNNMl
A significant part of ecology deals with the interaction of populations of organisms with other organisms and with their environment. Study of a single individual does not meet the study objectives of ecology.

Question 14.3

merhUx0lc4Sy8oykdGEKEJi7ZZQ/E9s1ft9uUXZApNofONiiZLiaaXeRzvZ1AHEGZljlTsef2Z5RUL7iArvmcz0V9fKDJ+8lD83fjCnKwperBtHoem20cPsUzgC9jktA3fm15jeOgnSx50Z3qJ1zYhMUfYFaF8pV/4I1JokEJa/RCCTE4zb5CgbXelQ=
The population size would decrease. For population size to stay the same (or increase), each mating pair must produce two (or more) offspring that reach sexual maturity.

Question 14.4

tT1mzLLqV0BeOFWREdZgYVRXuBYrLVLlb/kB2t6/YCyjyuBurcpEfmLEreaolOhGGJY2o1VRPMGdGTKqyWaEmfafbCoRIEspH2B81JKWxMdpPUEbVRNo1WRjkyFpRssOUb53KEd9uk8GOzDaALrJCvmcq+Ft8JErfmVkhq8P3YU0avseU5p7KpBcQ1PTIAK4ni4Bx6IvroT92pir
Density-dependent factors are pressures on a population’s growth that result from population size itself. These factors include limitations on resources such as food, water, and space. As the population size increases, fewer resources are available to support the greater number of organisms. Density-independent factors do not result from population size, but usually result from geological or meteorological forces, such as earthquakes or hurricanes, or from human activity that degrades the environment. These factors lower the environment’s potential to support populations of organisms.

Question 14.5

P7hN8v7VdovoGSp63CXUsmJz0SBkmyoFP7ADsn1DtHt/B4iK+J0gjLJxiAE4J0eV09rq0Io1J1ccEQ2RwwAqe2KrEAavcMzDisV8Dqfv9YsbTNMSLVZ/3vwnA2+sOKhW5QIkQBmuWOYBU41QVGUbd11laB/q9bbJG53qOw==
(a) Populations of desert locusts in northwest Africa sometimes undergo explosive growth. These locusts usually live solitary lives, but on occasion, for reasons not entirely understood, they form large migrating swarms that cause extensive crop damage. (b) The lynx and snowshoe hare populations of Canada undergo periodic oscillations. As the snowshoe hare population increases, the lynx, which feed on snowshoe hares, begin to increase in number. As the lynx population increases, more and more snowshoe hares are hunted and eaten by the lynx, causing the snowshoe hare population to decrease. Eventually, the decrease in number of snowshoe hares causes the lynx population to decrease, and the snowshoe hare population again increases. This pattern occurs repeatedly.

Question 14.6

EQgK56Fx/fgkB24KvK19D6WI91Rh6w1fiLCzczJKuJx/AIkHc8hGNoCt2DQpuQl3t2S2rIlgm+4MtryMuHvUfqH+jMHsaasxiowq5FUbg1amN9q9VTcdNX8YoVxLyz3sIGXHmg==
Maximum yield is obtained by the harvesting or removal of all or almost all available organisms of a specific kind to be used as food or for other purposes. Not enough of the organisms remain to allow normal population growth. Maximum sustainable yield is the maximum number of organisms that can be harvested or removed but still allow the normal growth of the population.

Question 14.7

qs4W2fRp+lRIOZNgIRS4D8y16h+enpZnG03u7RrRldq2qNKPN0qpB52daNXNHzlRAGEkKq9TaZ6kCbeeLklaY8lMBYYRDHebsxTwoR1EDlAw59UXllERvA==
To determine the organism’s life history, you would need to know when the organism reproduces, how often it reproduces, and how many offspring it produces.

Question 14.8

iQdq22zRFxYijv+NRUAGJKIaRqDqrBweNmjhz1zSDmtL/nU7Zidil9ylNvQU5SEMxxrDJRtCXpQOuJ63WbYzJ5HV4UO0I/ThSuWW4CWfDZH15PathHzAy5E8TxeiSaOwTiT1VFy/6aqI/zDRbTErLQ==
Organisms with a type I survivorship curve produce a small number of offspring and have a high probability of surviving every age interval until they reach old age. Examples include most mammals and the giant tortoise.

Question 14.9

b7LGjfjKaMrie5RUCxAqlnkmzQ8iejtKXkfnAEwE7PymgcKoOhYRNbcYmS2SLYJNIvQuKf+qoqRzYiE58R9gSZMu9KKy01Bo6PvdVVJ1DKHSCvFPbmTVploLxfLjwgxRKFknCsFkQWoy8X+W/l1LU5TKtZvMNvxT3lDAjS21lnPLoE2BC4eKu4RZp05OFdoDetDBGzWn/q8AGb6acGmr+olucUS1JTtVwDLJFU9oNgRXOR+f
Organisms with a shorter breeding season produce more offspring per reproductive event than organisms with a longer breeding season. Generally, the closer an organism lives to the equator, the longer the breeding season.

Question 14.10

omTO79HfjcGTC4Otdtx3quBuWDyH+gUJHOlNKnqyliyzcvWi++sx7NGNfylgWGW1WSYaxK95u8PP/eACuOURKpaJOxcam/bRH699GuBEyJZSK6odByLNL318yiPM9b3y+Uiqr/4lUbL7Knll
Sickness and death early in life prevent reproduction and the passing of alleles to the next generation, and thus the prevalence of alleles that cause disease and death early in life will be reduced in a population over time.

Question 14.11

TiZOSzuRt2K2GWdmw2BtlIuMZTYcZX7sejYQOAJ2J/+fN0oH2ZGpd3mBRl1pJhxFhs/CHlCsJC+Bq8rWwJJ0CuYdVLZX1lkUKTN0p0J67qsby/VW2w9ZU9FPxSSmLVAD6Lq2+0Ht4y4V3K4FqtCfSiGL1v00KZTl/6f3THDm455s2vpHoedPhjywNY8=
Species that have evolved in environments that present a high risk of dying at a relatively early age live shorter lives, reproduce earlier, and have more offspring per reproductive event than species that have evolved in environments that present a relatively low risk of dying. If a species that evolved in a high-risk environment were transferred to a low-risk environment, it could eventually evolve to live longer, breed later, and have fewer offspring.

Question 14.12

2afnj27eT6yzTuLvp44WB4vq6ur7+baAw8H6Gph9Y2aCh/+R2QRVDYjwwB01jX1t9DAJ8fBWizeJeqnHkSeGlKCCN3MwpSL21h/CXdqbwtFdRfNvp90GRvHdt5ppRuda0BhF1d1P9mY=
Researchers began with a large number of fruit flies, and after 2 weeks they supplied them with a fresh dish of food and collected the eggs laid in the dish. They measured the longevity of some flies hatched from these eggs (average life span 33 days), and repeated the procedure with this new generation of flies—but this time waiting longer than 2 weeks to collect eggs. They repeated the procedure a number of times, gradually increasing the time until eggs were collected up to 10 weeks, and in this way almost doubled the average life span of the flies to 63 days.

Question 14.13

8svBtPY/K+M/1MFoBNGl8cLFnEg3wxh8rXPH7llCwxypRe86StFOLGtLdWSiMEmfFgoDsdzmpN78cetG6n3b9i0ubDZC38jWFh4b+AdRNhBshnK9QMK0Raip2lBvub8e2mOF9rmL4BnaG/zBUJu3Hic6rzE=
These data can be used for planning and meeting the needs of people in different age groups, called cohorts. For instance, based on the current size of particular cohorts, the data would be useful for planning when and how many schools or other child services might be needed, or hospital maternity services, or assisted living facilities for the elderly.

Question 14.14

cblQUjZAh2pTKmm/LJUhZtQ6A7bHolQO4+o7y7mB+vQQF0Awo3R1HNJhbKhqTDnoWcuVUf+Vx6U=
“Demographic transition” refers to the change in the make-up of a region’s population as it progresses from high birth rates and death rates, to high birth rates and low death rates, then finally to low birth rates and death rates.

Question 14.15

+KhG/cIoPVTITq3Ffxha+GXHEXvcQTBbh5S5T7/61xVfHynEI8IgM5eyDPB9ABwyRGdwMHJ/W/FS2d8Be2fZKPTreiyhgf31BGz2mAnRmFitrUX5YGDxul6ckuQMXa9D7DoQnrHWJ4LlH5eqDqa2kzmDQehv+wY2ITeHLOmgA68=
The ecological footprint of a population is a description of the amount of resources it uses. Average resource use by each person is so much greater in Japan than in India, which is a much poorer nation, that, overall, the smaller population of Japan has a larger ecological footprint than the larger population of India. Generally, as nations become richer, their ecological footprint increases.

Activity results are being submitted...