
Chapter 10. Chapter 10 Graphic Content
Introduction
Graphic Content
true
true
You must read each slide, and complete the question on the slide, before proceeding to the next one.
Instructions
Review the information provided in the graph to answer each question below.
After submitting your answer, you will be provided feedback to check if your response is correct.
(This activity contains 6 questions.)
1.
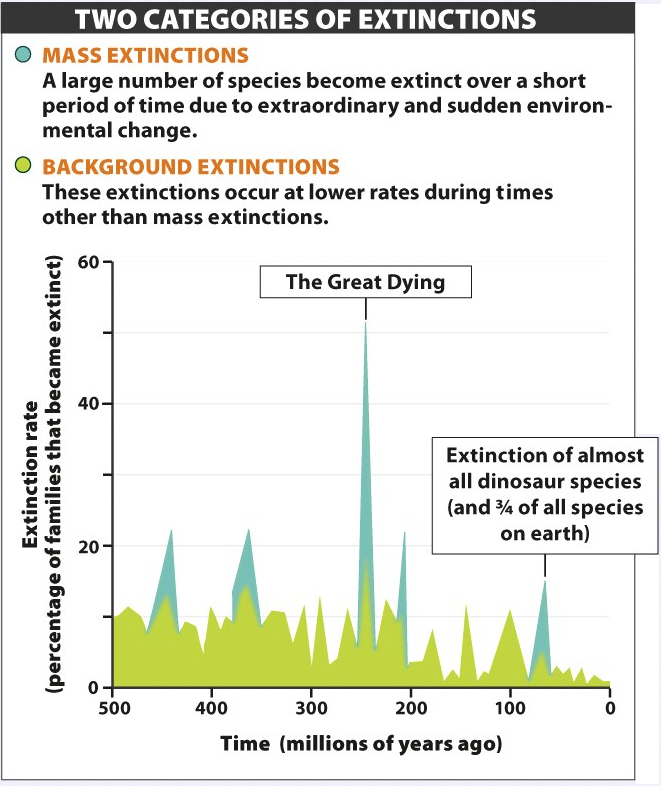
1. What is the approximate rate of background extinctions over the time period shown here?
The blue line hovers around a rate of 10% of families becoming extinct at any time during the period recorded on the graph.
Activity results are being submitted...