Chapter 14. Chapter 14 Graphic Content

Introduction

Graphic Content
true
true
You must read each slide, and complete the question on the slide, before proceeding to the next one.

Instructions

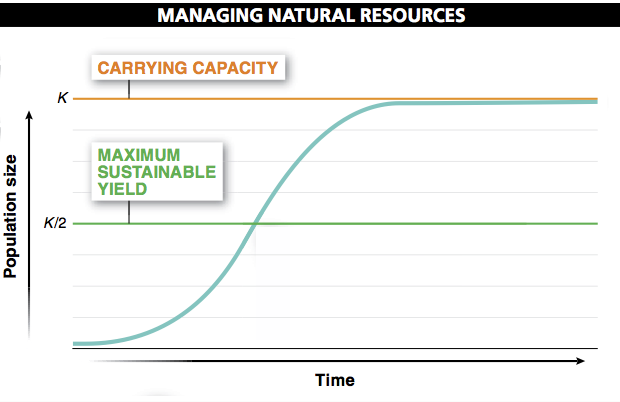
Review the information provided in the graph to answer each question below.

After submitting your answer, you will be provided feedback to check if your response is correct.

(This activity contains 7 questions.)

Question 14.1

zAElrJ9z7T1DD7vaiHAfegdKH07oQApSk9mOLXsNJXAxK3G4OfKh2UtZP2s=
The graph shows how a population’s size changes over time. Based on the graph’s title, “Managing Natural Resources,” it also is intended to reveal something about how knowledge of population growth can help resource managers be more effective. Specifically, it shows the size at which a population can most effectively be utilized for natural resources, which may involve cutting down some trees for wood or catching some lobsters for food, for example.

Question 14.2

7TKK2N89oOgnSkY43SnKRdI/JVRnSpqHp3laljReJIR6dhpNZvvbDIBDQvA5bIhH1HN6wkP3FVrxgIlpTm9Tww==
As a population gets closer to the carrying capacity of its environment, its growth slows and plateaus at that point.

Question 14.3

gL9c4yD1zxX+4mDbw78RrdOTFTTNnk/9TYv5vaDe10iHpkuN1JoblupbOTYrhgYzwsTlFXRu0ZCSyRPDmr7saGJEA8fiTxylth29YpYw8n4teVDC/5A+1wog70LTZUY9qzQ/a6hzKP8r752WokYSEBtlnoUzCX+7yfjlIWDgR94eUCx0qnCkMWLPTXY=
A population can stay at the same size if the number of individuals arriving (through birth or immigration) is exactly the same as the number of individuals leaving (through death or emigration). This situation can persist indefinitely, even as organisms continue dying.

Question 14.4

6kgFybS4+A1Av7j7J7+dAC1UF9TpFRiAdD10OooFA1oR8MkanMVCkgkSDiPU5pAV
No data points appear on the graph. This suggests that perhaps the graph just presents a theoretical relationship. In this case, it appears to be the relationship between population size and time, when a population is growing logistically, calculated as: rN [ (K – N ) / K ].

Question 14.5

BEoM86GTs4oQRHJJDujTVu3mXwg7PD3iZi6VRNDEhRcu8i+Tk4cpP5ImTJN76xGxkMrJ8g86Oro=
It would be helpful if some real data were presented for actual populations, showing how they grow over time. The data points could be overlaid on the graph, perhaps with points for different populations shown in different colors. This would give insight into how well the logistic growth equation predicts the actual growth of natural populations.

Question 14.6

VHI+vRcX6hNTT+SnduBzZFYtxV2CLJvcKyekzIVtvldgdtr5tKlF/yOZWO04HGc9t+Wcm9nqSI67pU9YAD30DgoFTbIYwcP42KBvJZTo6cwI7SEkGWKzQnQbeo8=
Implicit assumptions are, first, that carrying capacity does not change over time, and second, that a population’s growth is restrained with perfect efficiency as it approaches its carrying capacity. In other words, growth slows exactly as required to avoid exceeding the carrying capacity—as opposed to the population growing so quickly that it overshoots its carrying capacity, after which it grows more slowly, possibly undershooting K, and ultimately oscillating around it.

Question 14.7

2Pag5eKmsx08ul28ET0m2kqxazsnMPtSm2YetVm/oz85/krh3KryUUHTlW06sNkMIlri229yB9oauUeB2+hgxXvkjU+R1kmInqVTchuPYlUB2SEl6ORd5yTPskOQset8uixfiSjnkHaNkke1xEgYT+kWVYm+ZXoOD4DZEjb7cyceLYE+82DBV+74Xicw6S0hhaOoNzEgE5GEf3mmJ/5wGcHFLWzLS8UqcxZ3V8SaxJcDaOIjLXSxPJdQDIdfUGif6Z87CGzKlWDBOVBNIvpjU+BAvOplvfNC/a3CPKU74xnLC1l5
The graph described in the question will show a sort of inverted "U," with the low points of growth rate at population sizes 0 and K, and with the maximum in the middle of the x-axis at K / 2. The population grows fastest when it is at half its carrying capacity.

Activity results are being submitted...