
Chapter 15. Chapter 15 Graphic Content
Introduction
Graphic Content
true
true
You must read each slide, and complete the question on the slide, before proceeding to the next one.
Instructions
Review the information provided in the graph to answer each question below.
After submitting your answer, you will be provided feedback to check if your response is correct.
(This activity contains 6 questions.)
1.
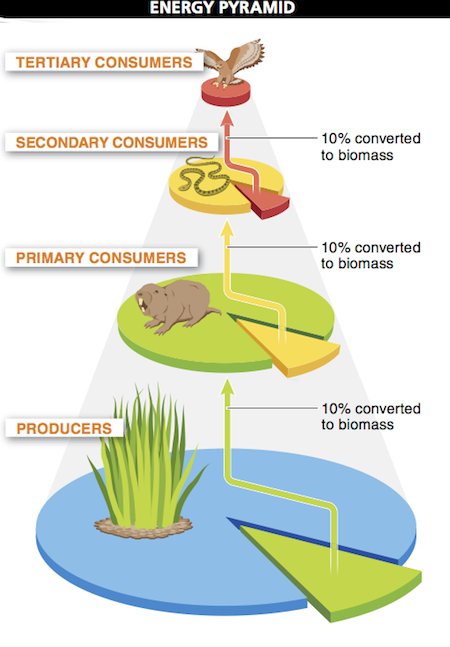
1. Why is the drawing of the hawk so much smaller than those of the other organisms?
The drawings are roughly proportional in size to the biomass of each level in the energy pyramid (i.e., primary producer, primary consumer, secondary consumer, tertiary consumer) for this particular type of ecosystem.
Activity results are being submitted...