
Chapter 16. Chapter 16 Graphic Content
Introduction
Graphic Content
true
true
You must read each slide, and complete the question on the slide, before proceeding to the next one.
Instructions
Review the information provided in the graph to answer each question below.
After submitting your answer, you will be provided feedback to check if your response is correct.
(This activity contains 6 questions.)
1.
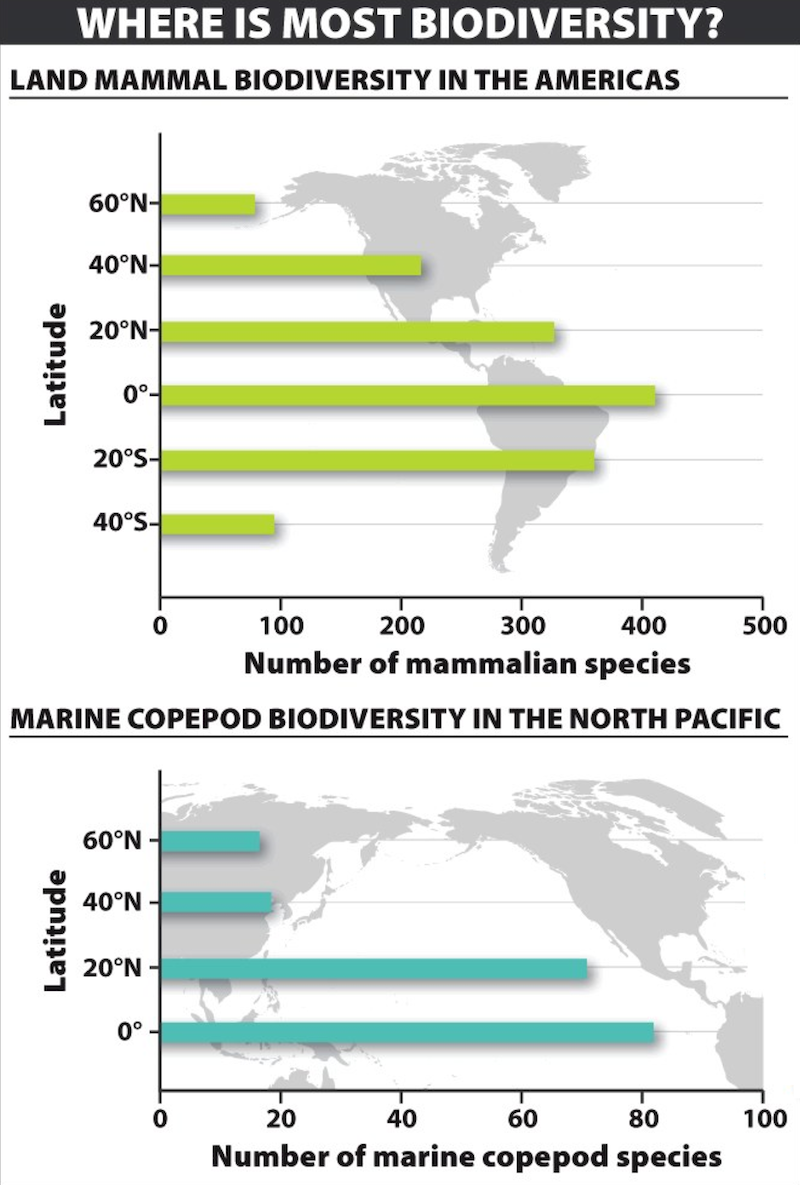
1. What are the axes for these graphs? What are the variables being observed?
There are two graphs. Each presents data on the number of species present at different latitudes, from the equator toward the Poles. The x-axis shows the number of species: in the top graph, the number of mammalian species, and in the bottom graph, the number of marine copepod species. The y-axis shows the latitude. In the top graph, data are presented for the numbers of species at 40° and 20° south, the equator, and 20°, 40°, and 60° north. In the bottom graph, data are presented for the equator and 20°, 40°, and 60° north.
Activity results are being submitted...