
Chapter 2. Chapter 2 Graphic Content
Introduction
Graphic Content
true
true
You must read each slide, and complete the question on the slide, before proceeding to the next one.
Instructions
Review the information provided in the graph to answer each question below.
After submitting your answer, you will be provided feedback to check if your response is correct.
(This activity contains 7 questions.)
1.
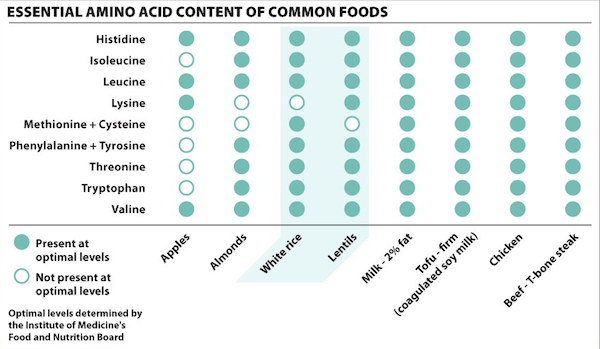
1. In this figure, what does a blue dot indicate? What does a white dot indicate?
A blue dot in a column indicates that the food summarized in that column carries the optimal level of the amino acid(s) listed for that row. A white dot indicates that the food does not contain optimal levels of that amino acid(s). For example, lentils contain optimal levels of the amino acid cysteine, but white rice does not.
Activity results are being submitted...