Chapter 20. Chapter 20 Graphic Content
Introduction
Graphic Content
true
true
You must read each slide, and complete the question on the slide, before proceeding to the next one.

Instructions
Review the information provided in the graph to answer each question below.
After submitting your answer, you will be provided feedback to check if your response is correct.
(This activity contains 8 questions.)
Question 20.1
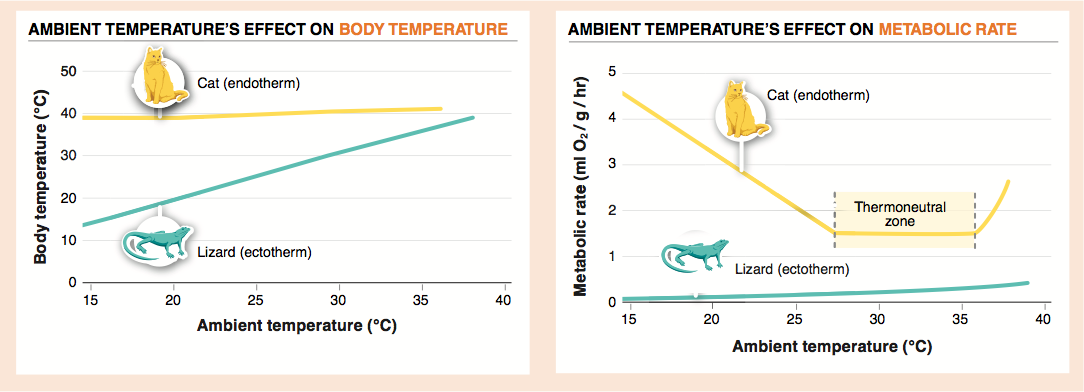
The line showing the cat body temperature (on the y-axis) as a function of ambient temperature (on the x-axis) shows a very slight increase. For this reason, you could say that cats’ body temperature is influenced by the ambient temperature. However, the effect is very, very small. Over an increase of about 17°C, cats’ body temperature rises by only one or two degrees. For this reason, it would be more accurate to say that cats’ body temperature is almost completely unaffected by ambient temperature.
Question 20.2
The line showing the cat body temperature (on the y-axis) as a function of ambient temperature (on the x-axis) shows a very slight increase. For this reason, you could say that cats’ body temperature is influenced by the ambient temperature. However, the effect is very, very small. Over an increase of about 17°C, cats’ body temperature rises by only one or two degrees. For this reason, it would be more accurate to say that cats’ body temperature is almost completely unaffected by ambient temperature.
Question 20.3
Metabolic rate, as shown in the lower graph, is measured as the amount of oxygen consumption (in milliliters) per gram of body weight per hour. At any ambient temperature, cat metabolic rate is higher than lizard metabolic rate.
Question 20.4
In order to make the comparison in metabolic rates meaningful, it is reported as a function of the animals’ body weight. In other words, the difference in weight is factored out so that in both organisms, metabolism is measured as a rate rather than a total consumption of oxygen.
Question 20.5
Between 27° and 36°C, lizard metabolic rate increases from about 0.15 ml O2/g/hr to 0.35 ml O2/g/hr. In other words, lizards’ metabolic rate more than doubles. Across the same temperature range, the cat metabolic rate does not increase at all.
Question 20.6
Lizard metabolic rate is considerably lower than cat metabolic rate at every temperature reported. Lizard metabolic rate, however, increases dramatically between 27° and 36°C while cat metabolic rate remains constant. In order to make this difference more apparent, for lizards you could use a y-axis with a different scale, perhaps multiplying the rate by 10. This would cause the steeper slope to be much more apparent, highlighting the greater influence of ambient temperature on metabolic rate in lizards as compared to cats. (Most textbooks do this.) A drawback to this method is that it may mislead readers into concluding that the metabolic rate itself is greater in lizards when it is not. It is only the rate of increase that is greater.
Question 20.7
From this graph it appears that “thermoneutral zone” refers to a range of ambient temperatures across which an animal’s metabolic rate remains unchanged. Cats have a clear thermoneutral zone, while it does not appear that lizards have such a thermoneutral zone. Any increase in ambient temperature is accompanied by an increase in metabolic rate.
Question 20.8
From these graphs, we can conclude that at ambient temperatures between 27° and 36°C, it is more efficient to be a homeotherm. When the ambient temperature falls below 27°C or rises above 36°C, however, metabolic costs in homeotherms rise more dramatically than they do in ectotherms, suggesting that it is more efficient under such conditions to be an ectotherm.
Activity results are being submitted...