
Chapter 24. Chapter 24 Graphic Content
Introduction
Graphic Content
true
true
You must read each slide, and complete the question on the slide, before proceeding to the next one.
Instructions
Review the information provided in the graph to answer each question below.
After submitting your answer, you will be provided feedback to check if your response is correct.
(This activity contains 8 questions.)
1.
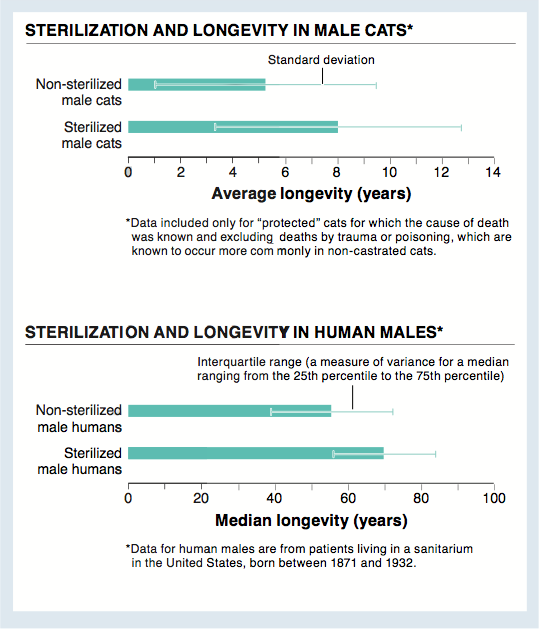
1. What is the “take-home message” of these graphs? What additional data would be helpful? Why?
The take-home message of these graphs is that sterilization seems to increase longevity in male mammals. In order to have greater confidence in this take-home message, it would be helpful to know whether there were similar changes in causes of mortality in cats and humans following sterilization. For example, if rates of death from cancer decreased similarly, that would support the take-home message while suggesting a possible mechanism for this effect.
Activity results are being submitted...