
Chapter 7. Chapter 7 Graphic Content
Introduction
Graphic Content
true
true
You must read each slide, and complete the question on the slide, before proceeding to the next one.
Instructions
Review the information provided in the graph to answer each question below.
After submitting your answer, you will be provided feedback to check if your response is correct.
(This activity contains 6 questions.)
1.
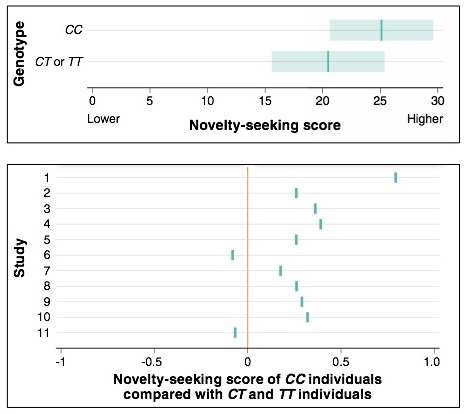
1. What variable was measured? How was it measured? Is there a better way that it could have been measured?
A novelty-seeking score was measured for individuals with different genotypes. Measurement was based on the individuals’ responses on a questionnaire. While this might be a fast and easy way to estimate one person’s propensity for novelty-seeking relative to another person’s propensity, it would have been better to observe individuals’ actual behavior. If you are interested in behavior, it is always better to see how someone behaves than to ask them how they think they would behave.
Activity results are being submitted...