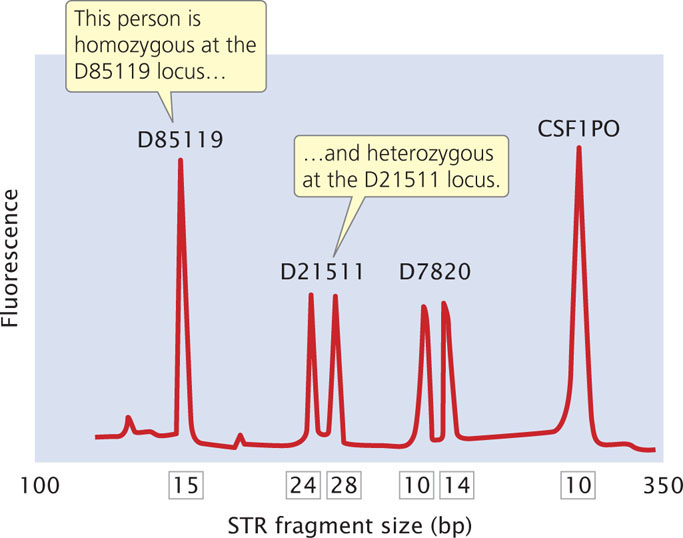
Figure 19.29: A DNA profile represents the pattern of DNA fragments produced following PCR of the STR loci. This profile shows the results from four STR loci (D8S1179, D21S11, D7S820, and CSF1P0). The number below each peak represents the number of STR repeats in that DNA fragment.