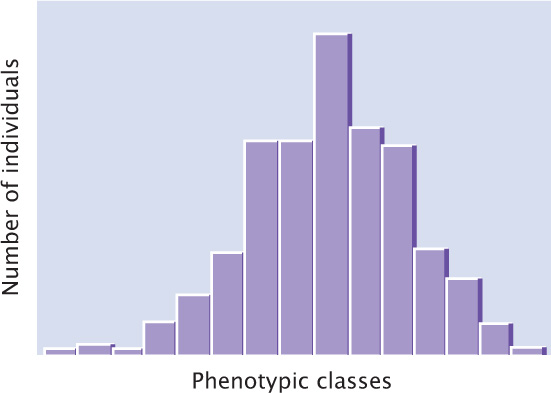
Figure 24.6: A frequency distribution is a graph that displays the number or proportion of different phenotypes. Phenotypic values are plotted on the horizontal axis, and the numbers (or proportions) of individuals in each class are plotted on the vertical axis.