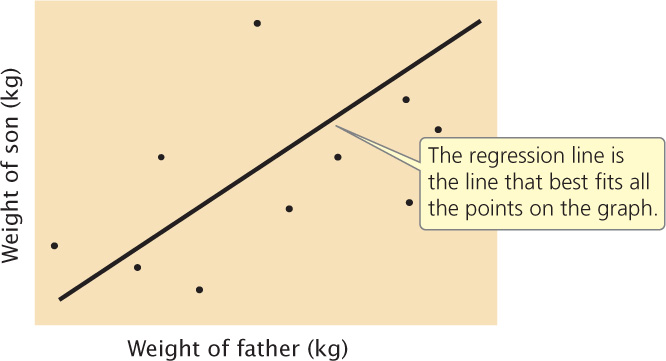
Figure 24.13: A regression line defines the relation between two variables. Illustrated here is a regression of the weights of fathers against the weights of sons. Each father-son pair is represented by a point on the graph: the x value of a point is the father’s weight and the y value of the point is the son’s weight.