Application Questions and Problems
Section 20.1
Question 20.25
A 22-kb piece of DNA has the following restriction sites:
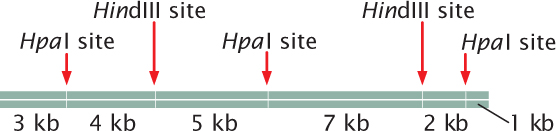
A batch of this DNA is first fully digested by HpaI alone, then another batch is fully digested by HindIII alone, and, finally, a third batch is fully digested by both HpaI and HindIII together. The fragments resulting from each of the three digestions are placed in separate wells of an agarose gel, separated by gel electrophoresis, and stained by ethidium bromide. Draw the bands as they would appear on the gel.
Question 20.26
A linear piece of DNA that is 14 kb long is cut first by EcoRI alone, then by SmaI alone, and, finally, by both EcoRI and SmaI together. The following results are obtained:
| Digestion by EcoRI alone | Digestion by SmaI alone | Digestion by both EcoRI and SmaI |
|---|---|---|
| 3-kb fragment | 7-kb fragment | 2-kb fragment |
| 5-kb fragment | 7-kb fragment | 3-kb fragment |
| 6-kb fragment | 4-kb fragment | |
| 5-kb fragment |
Draw a map of the EcoRI and SmaI restriction sites on this 14-kb piece of DNA, indicating the relative positions of the restriction sites and the distances between them.
609
Question 20.27
The presence (+) or absence (–) of six sequence-tagged sites (STSs) in each of five bacterial artificial chromosome (BAC) clones (A-E) is indicated in the following table. Using these markers, put the BAC clones in their correct order and indicate the locations of the STS sites within them.
| STSs | ||||||
|---|---|---|---|---|---|---|
| BAC clone | 1 | 2 | 3 | 4 | 5 | 6 |
| A | + | – | – | – | + | – |
| B | – | – | – | + | – | + |
| C | – | + | + | – | – | – |
| D | – | – | + | – | + | – |
| E | + | – | – | + | – | – |
Question 20.28
A linear piece of DNA was broken into random, overlapping fragments and each fragment was sequenced. The sequence of each fragment is shown below.
Fragment 1: 5′–TAGTTAAAAC–3′
Fragment 2: 5′–ACCGCAATACCCTAGTTAAA–3′
Fragment 3: 5′–CCCTAGTTAAAAC–3′
Fragment 4: 5′–ACCGCAATACCCTAGTT–3′
Fragment 5: 5′–ACCGCAATACCCTAGTTAAA–3′
Fragment 6: 5′–ATTTACCGCAAT–3′
On the basis of overlap in sequence, create a contig sequence of the original fragment.
Question 20.29
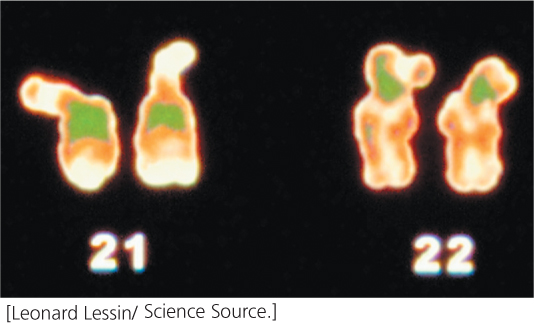
How does the density of genes found on chromosome 22 compare with the density of genes found on chromosome 21, two similar-sized chromosomes? How does the number of genes on chromosome 22 compare with the number found on the Y chromosome?
To answer these questions, go to www.ensembl.org. Under the heading Species, select Human. On the left-hand side of the next page click on Karyotype. Pictures of the human chromosomes will appear. Click on chromosome 22 and select Chromosome Summary. You will be shown a picture of this chromosome and a histogram illustrating the densities of total genes (uncolored bars) and of known genes (colored bars). The total numbers of genes, along with the chromosome length in base pairs are given at the bottom of the diagram. Write down the total length of the chromosome and the number of protein-coding genes.
Now go to chromosome 21 by selecting it from the Change Chromosome drop-down. Examine the total length and total number of protein-coding genes for chromosome 21. Now do the same for the Y chromosome. Calculate the gene density (number of genes/length) for chromosomes 22, 21, and Y.
- a. Which chromosome has the highest density and greatest number of genes? Which has the fewest?
- b. Examine in more detail the genes at the tip of the short arm of the Y chromosome by clicking on the top bar in the histogram of genes. Jump to location view. A more detailed view will be shown. What known genes are found in this region? How many protein-coding genes are there in this region?
Question 20.30
 In recent years, honeybee colonies throughout North America have been decimated by the rapid death of worker bees, a disorder termed colony collapse disorder (CCD). First noticed by beekeepers in 2004, the disorder has been responsible for the loss of 50% to 90% of beekeeping operations in the United States. Evidence suggests that CCD is caused by a pathogen. Diana Cox-Foster and her colleagues (2007. Science 318:283-287) used a metagenomic approach to try to identify the causative agent of CCD by isolating DNA from normal honeybee hives and from hives that had experienced CCD. A number of different bacteria, fungi, and viruses were identified in the metagenomic analysis. The following table gives the percentage of CCD hives and non-CCD hives that tested positive for four potential pathogens identified in the metagenomic analysis. On the basis of these data, which potential pathogen appears most likely to be responsible for CCD? Explain your reasoning. Do these data prove that this pathogen is the cause of CCD? Explain.
| Virus | CCD hives infected (n = 30) | Non-CCD hives infected (n = 21) |
|---|---|---|
| Israeli acute paralysis virus | 83.3% | 4.8% |
| Kashmir bee virus | 100% | 76.2% |
| Nosema apis | 90% | 47.6% |
| Nosema cernae | 100% | 80.8% |
Question 20.31
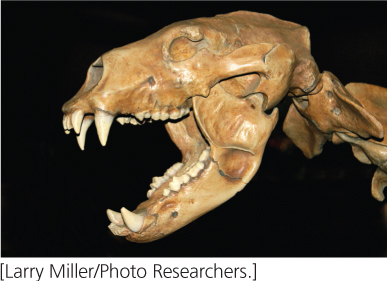
James Noonan and his colleagues (2005. Science 309:597–599) set out to study genome sequences of an extinct species of cave bear. They extracted DNA from 40,000-year-old bones from a cave bear and used a metagenomic approach to isolate, identify, and sequence the cave-bear DNA. Why did they use a metagenomic approach when their objective was to sequence the genome of one species (the cave bear)?
610
Section 20.2
Question 20.32
In Figure 20.9, explain why genes A2 and B2 are orthologs and not paralogs.
Question 20.33
Examine Figure 26.18. Are the epsilon (ε) and beta (β) genes on chromosome 11 orthologs or paralogs? Explain your answer.
Question 20.34
Microarrays can be used to determine levels of gene expression. In one type of microarray, hybridization of the red (experimental) and green (control) cDNAs is proportional to the relative amounts of mRNA in the samples. Red indicates the overexpression of a gene and green indicates the underexpression of a gene in the experimental cells relative to the control cells, yellow indicates equal expression in experimental and control cells, and no color indicates no expression in either experimental or control cells.
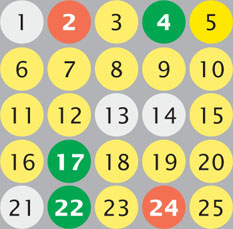
In one experiment, mRNA from a strain of antibiotic-resistant bacteria (experimental cells) is converted into cDNA and labeled with red fluorescent nucleotides; mRNA from a nonresistant strain of the same bacteria (control cells) is converted into cDNA and labeled with green fluorescent nucleotides. The cDNAs from the resistant and nonresistant cells are mixed and hybridized to a chip containing spots of DNA from genes 1 through 25. The results are shown in the adjoining illustration. What conclusions can you make about which genes might be implicated in antibiotic resistance in these bacteria? How might this information be used to design new antibiotics that are less vulnerable to resistance?
Question 20.35
For the genes in the microarray shown in the lower part of Figure 20.10, are most of these genes over expressed or under expressed in tumors from patients that remained cancer free for at least five years? Explain your reasoning.
Question 20.36
What does the photograph in Figure 20.12 reveal about the expression of β-tubulin?
Section 20.3
Question 20.37
Dictyostelium discoideum is a soil-dwelling, social ameba: much of the time, the organism consists of single, solitary cells, but, during times of starvation, amebae come together to form aggregates that have many characteristics of multicellular organisms. Biologists have long debated whether D. discoideum is a unicellular or multicellular organism; in 2005 its genome was completely sequenced. The table below lists some genomic characteristics of D. discoideum and other eukaryotes (L. Eichinger et al. 2005. Nature 435:43–57).
| Feature | D. discoideum | P. falciparium | S. cerevisiae | A. thaliana | D. melanogaster | C. elegans | H. sapiens |
|---|---|---|---|---|---|---|---|
| Organism | ameba | malaria parasite | yeast | plant | fruit fly | worm | human |
| Cellularity | ? | uni | uni | multi | multi | multi | multi |
| Genome size (millions of base pairs) | 34 | 23 | 13 | 125 | 180 | 103 | 2,851 |
| Number of genes | 12,500 | 5,268 | 5,538 | 25,498 | 13,676 | 19,893 | 22,287 |
| Average gene length (bp) | 1,756 | 2,534 | 1,428 | 2,036 | 1,997 | 2,991 | 27,000 |
| Genes with introns (%) | 69 | 54 | 5 | 79 | 38 | 5 | 85 |
| Mean number of introns | 1.9 | 2.6 | 1.0 | 5.4 | 4.0 | 5.0 | 8.1 |
| Mean intron size (bp) | 146 | 179 | nd* | 170 | nd* | 270 | 3,365 |
| Mean G + C (exons) | 27% | 24% | 28% | 28% | 55% | 42% | 45% |
| *nd = not determined | |||||||
611
- a. On the basis of the organisms listed in the table other than D. discoideum, what are some differences in genome characteristics between unicellular and multicellular organisms?
- b. On the basis of these data, do you think the genome of D. discoideum is more like those of other unicellular eukaryotes or more like those of multicellular eukaryotes? Explain your answer.
Question 20.38
How do the following genomic features of prokaryotic organisms compare with those of eukaryotic organisms? How do they compare among eukaryotes?
- a. Genome size
- b. Number of genes
- c. Gene density (bp/gene)
- d. Number of exons
Question 20.39
A group of scientists sequenced the genomes of 12 species of Drosophila (Drosophila 12 Genomes Consortium. 2007. Nature 450:203–218). Data on genome size and number of protein-encoding genes from this study are given in the accompanying table. Plot the number of protein-encoding genes as a function of genome size for 12 species of Drosophila. Is there a relation between genome size and number of genes in fruit flies? How does this compare with the relation between genome size and number of genes across all eukaryotes?
| Species | Genome Size (millions of base pairs) | Number of Protein-Encoding Genes |
|---|---|---|
| D. melanogaster | 200 | 13,733 |
| D. simulans | 162 | 15,983 |
| D. sechellia | 171 | 16,884 |
| D. yakuba | 190 | 16,423 |
| D. erecta | 135 | 15,324 |
| D. ananassae | 217 | 15,276 |
| D. pseudoobscura | 193 | 16,363 |
| D. persimilis | 193 | 17,325 |
| D. willistoni | 222 | 15,816 |
| D. virilis | 364 | 14,680 |
| D. mojavensis | 130 | 14,849 |
| D. grimshawi | 231 | 15,270 |
Section 20.4
Question 20.40
A scientist determines the complete genomes and proteomes of a liver cell and a muscle cell from the same person. Would you expect bigger differences in the genomes or proteomes of these two cell types? Explain your answer.