Application Questions and Problems
Section 24.1
Question 24.16
For each of the following characteristics, indicate whether it would be considered a discontinuous characteristic or a quantitative characteristic. Briefly justify your answer.
- a. Kernel color in a strain of wheat, in which two codominant alleles segregating at a single locus determine the color. Thus, there are three phenotypes present in this strain: white, light red, and medium red.
- b. Body weight in a family of Labrador retrievers. An autosomal recessive allele that causes dwarfism is present in this family. Two phenotypes are recognized: dwarf (less than 13 kg) and normal (greater than 23 kg).
- c. Presence or absence of leprosy. Susceptibility to leprosy is determined by multiple genes and numerous environmental factors.
- d. Number of toes in guinea pigs, which is influenced by genes at many loci.
- e. Number of fingers in humans. Extra (more than five) fingers are caused by the presence of an autosomal dominant allele.
Question 24.17
Assume that plant weight is determined by a pair of alleles at each of two independently assorting loci (A and a, B and b) that are additive in their effects. Further assume that each allele represented by an uppercase letter contributes 4 g to weight and that each allele represented by a lowercase letter contributes 1 g to weight.
- a. If a plant with genotype AA BB is crossed with a plant with genotype aa bb, what weights are expected in the F1 progeny?
- b. What is the distribution of weight expected in the F2 progeny?
Question 24.18
Assume that three loci, each with two alleles (A and a, B and b, C and c), determine the differences in height between two homozygous strains of a plant. These genes are additive and equal in their effects on plant height. One strain (aa bb cc) is 10 cm in height. The other strain (AA BB CC) is 22 cm in height. The two strains are crossed, and the resulting F1 are interbred to produce F2 progeny. Give the phenotypes and the expected proportions of the F2 progeny.
Question 24.19
A farmer has two homozygous varieties of tomatoes. One variety, called Little Pete, has fruits that average only 2 cm in diameter. The other variety, Big Boy, has fruits that average a whopping 14 cm in diameter. The farmer crosses Little Pete and Big Boy; he then intercrosses the F1 to produce F2 progeny. He grows 2000 F2 tomato plants and doesn’t find any F2 offspring that produce fruits as small as Little Pete or as large as Big Boy. If we assume that the differences in fruit size of these varieties are produced by genes with equal and additive effects, what can we conclude about the minimum number of loci with pairs of alleles determining the differences in fruit size of the two varieties?
Question 24.20
Seed size in a plant is a polygenic characteristic. A grower crosses two pure-breeding varieties of the plant and measures seed size in the F1 progeny. She then backcrosses the F1 plants to one of the parental varieties and measures seed size in the backcross progeny. The grower finds that seed size in the backcross progeny has a higher variance than does seed size in the F1 progeny. Explain why the backcross progeny are more variable.
Section 24.2
Question 24.21
The following data are the numbers of digits per foot in 25 guinea pigs. Construct a frequency distribution for these data.
4, 4, 4, 5, 3, 4, 3, 4, 4, 5, 4, 4, 3, 2, 4, 4, 5, 6, 4, 4, 3, 4, 4, 4, 5
Question 24.22
Ten male Harvard students were weighed in 1916. Their weights are given here in kilograms. Calculate the mean, variance, and standard deviation for these weights.
51, 69, 69, 57, 61, 57, 75, 105, 69, 63
Question 24.23
Among a population of tadpoles, the correlation coefficient for size at metamorphosis and time required for metamorphosis is −0.74. On the basis of this correlation, what conclusions can you make about the relative sizes of tadpoles that metamorphose quickly and those that metamorphose more slowly?
712
Question 24.24
A researcher studying alcohol consumption in North American cities finds a significant, positive correlation between the number of Baptist preachers and alcohol consumption. Is it reasonable for the researcher to conclude that the Baptist preachers are consuming most of the alcohol? Why or why not?
Question 24.25
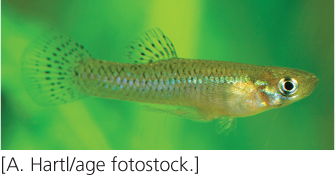
Body weight and length were measured on six mosquito fish; these measurements are given in the following table. Calculate the correlation coefficient for weight and length in these fish.
| Wet weight (g) | Length (mm) |
|---|---|
| 115 | 18 |
| 130 | 19 |
| 210 | 22 |
| 110 | 17 |
| 140 | 20 |
| 185 | 21 |
Question 24.26
The heights of mothers and daughters are given in the following table:
| Height of mother (in) | Height of daughter (in) |
|---|---|
| 64 | 66 |
| 65 | 66 |
| 66 | 68 |
| 64 | 65 |
| 63 | 65 |
| 63 | 62 |
| 59 | 62 |
| 62 | 64 |
| 61 | 63 |
| 60 | 62 |
- a. Calculate the correlation coefficient for the heights of the mothers and daughters.
- b. Using regression, predict the expected height of a daughter whose mother is 67 inches tall.
Section 24.3
Question 24.27
Phenotypic variation in the tail length of mice has the following components:
| Additive genetic variance (VA) | = 0.5 |
| Dominance genetic variance (VD) | = 0.3 |
| Genic interaction variance (VI) | = 0.1 |
| Environmental variance (VE) | = 0.4 |
| Genetic–environmental interaction variance (VGE) | = 0.0 |
- a. What is the narrow-sense heritability of tail length?
- b. What is the broad-sense heritability of tail length?
Question 24.28
The narrow-sense heritability of ear length in Reno rabbits is 0.4. The phenotypic variance (VP) is 0.8, and the environmental variance (VE) is 0.2. What is the additive genetic variance (VA) for ear length in these rabbits?
Question 24.29
Assume that human ear length is influenced by multiple genetic and environmental factors. Suppose you measured ear length on three groups of people, in which group A consists of five unrelated persons, group B consists of five siblings, and group C consists of five first cousins.
- a. With the assumption that the environment for each group is similar, which group should have the highest phenotypic variance? Explain why.
- b. Is it realistic to assume that the environmental variance for each group is similar? Explain your answer.
Question 24.30
A characteristic has a narrow-sense heritability of 0.6.
- a. If the dominance variance (VD) increases and all other variance components remain the same, what will happen to the narrow-sense heritability? Will it increase, decrease, or remain the same? Explain.
- b. What will happen to the broad-sense heritability? Explain.
- c. If the environmental variance (VE) increases and all other variance components remain the same, what will happen to the narrow-sense heritability? Explain.
- d. What will happen to the broad-sense heritability? Explain.
Question 24.31
Flower color in the varieties of pea plants studied by Mendel is controlled by alleles at a single locus. A group of peas homozygous for purple flowers is grown. Careful study of the plants reveals that all their flowers are purple, but there is some variability in the intensity of the purple color. What would the estimated heritability be for this variation in flower color? Explain your answer.
Question 24.32
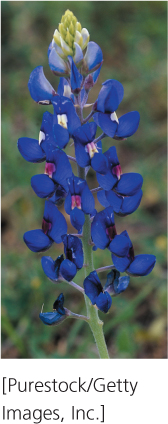
A graduate student is studying a population of bluebonnets along a roadside. The plants in this population are genetically variable. She counts the seeds produced by 100 plants and measures the mean and variance of seed number. The variance is 20. Selecting one plant, the student takes cuttings from it and cultivates them in the greenhouse, eventually producing many genetically identical clones of the same plant. She then transplants these clones into the roadside population, allows them to grow for 1 year, and then counts the number of seeds produced by each of the cloned plants. The student finds that the variance in seed number among these cloned plants is 5. From the phenotypic variance of the genetically variable and genetically identical plants, she calculates the broad-sense heritability.
- a. What is the broad-sense heritability of seed number for the roadside population of bluebonnets?
- b. What might cause this estimate of heritability to be inaccurate?
713
Question 24.33
Many researchers have estimated the heritability of human traits by comparing the correlation coefficients of monozygotic and dizygotic twins. One of the assumptions in using this method is that two monozygotic twins experience environments that are no more similar to each other than those experienced by two dizygotic twins. How might this assumption be violated? Give some specific examples of how the environments of two monozygotic twins might be more similar than the environments of two dizygotic twins.
Question 24.34
What conclusion can you draw from Figure 24.18 about the proportion of phenotypic variation in shell breadth that is due to genetic differences? Explain your reasoning.
Question 24.35
A genetics researcher determines that the broad-sense heritability of height among Southwestern University undergraduate students is 0.90. Which of the following conclusions would be reasonable? Explain your answer.
- a. Since Sally is a Southwestern University undergraduate student, 10% of her height is determined by nongenetic factors.
- b. Ninety percent of variation in height among all undergraduate students in the United States is due to genetic differences.
- c. Ninety percent of the height of Southwestern University undergraduate students is determined by genes.
- d. Ten percent of the variation in height among Southwestern University undergraduate students is determined by variation in nongenetic factors.
- e. Because the heritability of height among Southwestern University students is so high, any change in the students’ environment will have minimal effect on their height.
Question 24.36
The length of the middle joint of the right index finger was measured on 10 sets of parents and their adult offspring. The mean parental lengths and the mean offspring lengths for each family are listed in the following table. Calculate the regression coefficient for regression of mean offspring length against mean parental length and estimate the narrow-sense heritability for this characteristic.
| Mean parental length (mm) | Mean offspring length (mm) |
|---|---|
| 30 | 31 |
| 35 | 36 |
| 28 | 31 |
| 33 | 35 |
| 26 | 27 |
| 32 | 30 |
| 31 | 34 |
| 29 | 28 |
| 40 | 38 |
| 33 | 34 |
Question 24.37
Assume that in Figure 24.14, x equals the mean phenotype of the parents and y equals the mean phenotype of the offspring. Which line represents the highest heritability? Explain your answer.
Question 24.38
 Drosophila buzzatii is a fruit fly that feeds on the rotting fruits of cacti in Australia. Timothy Prout and Stuart Barker calculated the heritabilities of body size, as measured by thorax length, for a natural population of D. buzzatii raised in the wild and for a population of D. buzzatii collected in the wild but raised in the laboratory (T. Prout and J. S. F. Barker. 1989. Genetics 123:803–813). They found the following heritabilities.
| Population | Heritability of body size (± standard error) |
|---|---|
| Wild population | 0.0595 ± 0.0123 |
| Laboratory-reared population | 0.3770 ± 0.0203 |
Why do you think that the heritability measured in the laboratory-reared population is higher than that measured in the natural population raised in the wild?
Question 24.39
Mr. Jones is a pig farmer. For many years, he has fed his pigs the food left over from the local university cafeteria, which is known to be low in protein, deficient in vitamins, and downright untasty. However, the food is free, and his pigs don’t complain. One day a salesman from a feed company visits Mr. Jones. The salesman claims that his company sells a new, high-protein, vitamin-enriched feed that enhances weight gain in pigs. Although the food is expensive, the salesman claims that the increased weight gain of the pigs will more than pay for the cost of the feed, increasing Mr. Jones’s profit. Mr. Jones responds that he took a genetics class at university and that he has conducted some genetic experiments on his pigs; specifically, he has calculated the narrow-sense heritability of weight gain for his pigs and found it to be 0.98. Mr. Jones says that this heritability value indicates that 98% of the variance in weight gain among his pigs is determined by genetic differences, and therefore the new pig feed can have little effect on the growth of his pigs. He concludes that the feed would be a waste of his money. The salesman doesn’t dispute Mr. Jones’ heritability estimate, but he still claims that the new feed can significantly increase weight gain in Mr. Jones’ pigs. Who is correct and why?
Section 24.4
Question 24.40
Joe is breeding cockroaches in his dorm room. He finds that the average wing length in his population of cockroaches is 4 cm. He chooses six cockroaches that have the largest wings; the average wing length among these selected cockroaches is 10 cm. Joe interbreeds these selected cockroaches. From earlier studies, he knows that the narrow-sense heritability for wing length in his population of cockroaches is 0.6.
- a. Calculate the selection differential and expected response to selection for wing length in these cockroaches.
- b. What should be the average wing length of the progeny of the selected cockroaches?
Question 24.41
Three characteristics in beef cattle–body weight, fat content, and tenderness–are measured, and the following variance components are estimated:
714
| Body weight | Fat content | Tenderness | |
|---|---|---|---|
| VA | 22 | 45 | 12 |
| VD | 10 | 25 | 5 |
| VI | 3 | 8 | 2 |
| VE | 42 | 64 | 8 |
| VGE | 0 | 0 | 1 |
In this population, which characteristic would respond best to selection? Explain your reasoning.
Question 24.42
A rancher determines that the average amount of wool produced by a sheep in her flock is 22 kg per year. In an attempt to increase the wool production of her flock, the rancher picks five male and five female sheep with the greatest wool production; the average amount of wool produced per sheep by those selected is 30 kg. She interbreeds these selected sheep and finds that the average wool production among the progeny of the selected sheep is 28 kg. What is the narrow-sense heritability for wool production among the sheep in the ranchers flock?
Question 24.43
A strawberry farmer determines that the average weight of individual strawberries produced by plants in his garden is 2 g. He selects the 10 plants that produce the largest strawberries; the average weight of strawberries among these selected plants is 6 g. He interbreeds these selected plants. The progeny of these selected plants produce strawberries that weigh 5 g. If the farmer were to select plants that produce an average strawberry weight of 4 g, what would be the predicted weight of strawberries produced by the progeny of these selected plants?
Question 24.44
Has the response to selection leveled off in the strain of corn selected for high oil content shown in Figure 24.22? What does this observation suggest about genetic variation in the strain selected for high oil content?
Question 24.45
The narrow-sense heritability of wing length in a population of Drosophila melanogaster is 0.8. The narrow-sense heritability of head width in the same population is 0.9. The genetic correlation between wing length and head width is −0.86. If a geneticist selects for increased wing length in these flies, what will happen to head width?
Question 24.46
Pigs have been domesticated from wild boars. Would you expect to find higher heritability for weight among domestic pigs or wild boars? Explain your answer.