24.3 Heritability Is Used to Estimate the Proportion of Variation in a Trait That Is Genetic
In addition to being polygenic, quantitative characteristics are frequently influenced by environmental factors. Knowing how much of the variation in a quantitative characteristic is due to genetic differences and how much is due to environmental differences is often useful. The proportion of the total phenotypic variation that is due to genetic differences is known as the heritability.
Consider a dairy farmer who owns several hundred milk cows. The farmer notices that some cows consistently produce more milk than others. The nature of these differences is important to the profitability of his dairy operation. If the differences in milk production are largely genetic in origin, then the farmer may be able to boost milk production by selectively breeding the cows that produce the most milk. On the other hand, if the differences are largely environmental in origin, selective breeding will have little effect on milk production, and the farmer might better boost milk production by adjusting the environmental factors associated with higher milk production. To determine the extent of genetic and environmental influences on variation in a characteristic, phenotypic variation in the characteristic must be partitioned into components attributable to different factors.
Phenotypic Variance
To determine how much of the phenotypic variation in a population is due to genetic factors and how much is due to environmental factors, we must first have some quantitative measure of the phenotype under consideration. Consider a population of wild plants that differ in size. We could collect a representative sample of plants from the population, weigh each plant in the sample, and calculate the mean and variance of plant weight. This phenotypic variance is represented by VP.
697
Components of Phenotypic Variance
First, some of the phenotypic variance may be due to differences in genotypes among individual members of the population. These differences are termed the genetic variance and are represented by VG.
Second, some of the differences in phenotype may be due to environmental differences among the plants; these differences are termed the environmental variance, VE. Environmental variance includes differences in environmental factors such as the amount of light or water that the plant receives; it also includes random differences in development that cannot be attributed to any specific factor. Any variation in phenotype that is not inherited is, by definition, a part of the environmental variance.
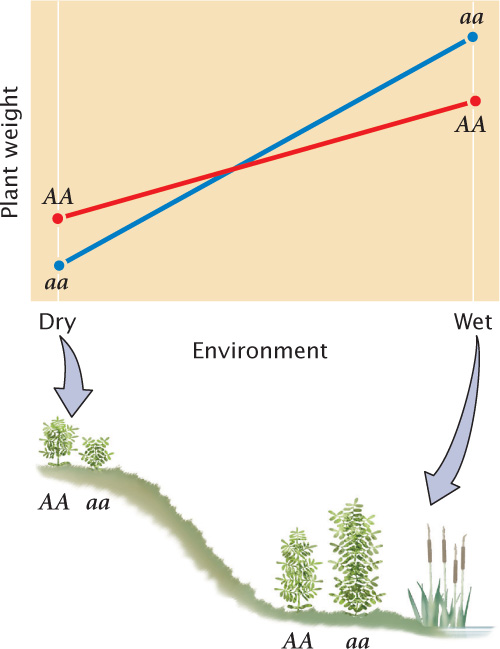
Third, genetic–environmental interaction variance (VGE) arises when the effect of a gene depends on the specific environment in which it is found. An example is shown in Figure 24.16. In a dry environment, genotype AA produces a plant that averages 12 g in weight, and genotype aa produces a smaller plant that averages 10 g. In a wet environment, genotype aa produces the larger plant, averaging 24 g in weight, whereas genotype AA produces a plant that averages 20 g. In this example, there are clearly differences in the two environments: both genotypes produce heavier plants in the wet environment. There are also differences in the weights of the two genotypes, but the relative performances of the genotypes depend on whether the plants are grown in a wet or a dry environment. In this case, the influences on phenotype cannot be neatly allocated into genetic and environmental components, because the expression of the genotype depends on the environment in which the plant grows. The phenotypic variance must therefore include a component that accounts for the way in which genetic and environmental factors interact.
In summary, the total phenotypic variance can be apportioned into three components:

Components of Genetic Variance
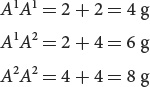
Genetic variance can be further subdivided into components consisting of different types of genetic effects. First, additive genetic variance (VA) comprises the additive effects of genes on the phenotype, which can be summed to determine the overall effect on the phenotype. For example, suppose that, in a plant, allele A1 contributes 2 g in weight and allele A2 contributes 4 g. If the alleles are strictly additive, then the genotypes would have the following weights:
The genes that Nilsson-Ehle studied, which affect kernel color in wheat, were additive in this way. The additive genetic variance primarily determines the resemblance between parents and offspring. For example, if all of the phenotypic variance is due to additive genetic variance, then the average phenotype of the offspring will be exactly intermediate between those of the parents.
Second, there is dominance genetic variance (VD) when some genes have a dominance component. In this case, the alleles at a locus are not additive; rather, the effect of an allele depends on the identity of the other allele at that locus. For example, with a dominant allele (T), genotypes TT and Tt have the same phenotype. Here, we cannot simply add the effects of the alleles together, because the effect of the small t allele is masked by the presence of the large T allele. Instead, we must add a component (VD) to the genetic variance to account for the way in which alleles interact.
Third, genes at different loci may interact in the same way that alleles at the same locus interact. When this genic interaction takes place, the effects of the genes are not additive. For example, Chapter 5 described how coat color in Labrador retrievers exhibits genic interaction; genotypes BB ee and bb ee both produce yellow dogs, because the effect of alleles at the B locus are masked when ee alleles are present at the E locus. With genic interaction, we must add a third component, called genic interaction variance (VI), to the genetic variance:

698
Summary Equation
We can now integrate these components into one equation to represent all the potential contributions to the phenotypic variance:

This equation provides us with a model that describes the potential causes of differences that we observe among individual phenotypes. It’s importatnt to note that this model deals strictly with the observable differences (variance) in phenotypes among individual members of a population; it says nothing about the absolute value of the characteristic or about the underlying genotypes that produce these differences.
Types of Heritability
The model of phenotypic variance that we’ve just developed can be used to determine how much of the phenotypic variance in a characteristic is due to genetic differences. Broad-sense heritability (H2) represents the proportion of phenotypic variance that is due to genetic variance and is calculated by dividing the genetic variance by the phenotypic variance:
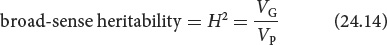
The symbol H2 represents broad-sense heritability because it is a measure of variance, which is in units squared.
Broad-sense heritability can potentially range from 0 to 1. A value of 0 indicates that none of the phenotypic variance results from differences in genotype and all of the differences in phenotype result from environmental variation. A value of 1 indicates that all of the phenotypic variance results from differences in genotypes. A heritability value between 0 and 1 indicates that both genetic and environmental factors influence the phenotypic variance.
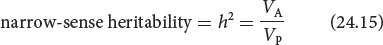
Often, we are more interested in the proportion of the phenotypic variance that results from the additive genetic variance because, as mentioned earlier, the additive genetic variance primarily determines the resemblance between parents and offspring. Narrow-sense heritability (h2) is equal to the additive genetic variance divided by the phenotypic variance:
![]() TRY PROBLEM 27
TRY PROBLEM 27
Calculating Heritability
Having considered the components that contribute to phenotypic variance and developed a general concept of heritability, we can now ask how we go about estimating these different components and calculating heritability. There are several ways to measure the heritability of a characteristic. They include eliminating one or more variance components, comparing the resemblance of parents and offspring, comparing the phenotypic variances of individuals with different degrees of relatedness, and measuring the response to selection. The mathematical theory that underlies these calculations of heritability is complex, and so, here, we will focus on developing a general understanding of how heritability is measured.
Heritability By Elimination of Variance Components
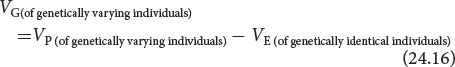
One way of calculating the broad-sense heritability is to eliminate one of the variance components. We have seen that VP = VG + VE + VGE. If we eliminate all environmental variance (VE = 0), then VGE = 0 (because, if either VG or VE is zero, no genetic–environmental interaction can take place), and VP = VG. In theory, we might make VE equal to 0 by ensuring that all individuals were raised in exactly the same environment but, in practice, it is virtually impossible. Instead, we could make VG equal to 0 by raising genetically identical individuals, causing VP to be equal to VE. In a typical experiment, we might raise cloned or highly inbred, identically homozygous individuals in a defined environment and measure their phenotypic variance to estimate VE. We could then raise a group of genetically variable individuals and measure their phenotypic variance (VP). Using VE calculated on the genetically identical individuals, we could obtain the genetic variance of the variable individuals by subtraction:
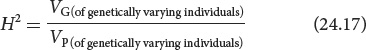
The broad-sense heritability of the genetically variable individuals would then be calculated as follows:
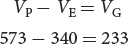
Sewall Wright used this method to estimate the heritability of white spotting in guinea pigs. He first measured the phenotypic variance for white spotting in a genetically variable population and found that VP = 573. Then he inbred the guinea pigs for many generations so that they were essentially homozygous and genetically identical. When he measured their phenotypic variance in white spotting, he obtained VP equal to 340. Because VG = 0 in this group, their VP = VE. Wright assumed this value of environmental variance for the original (genetically variable) population and estimated their genetic variance:
699
He then estimated the broad-sense heritability from the genetic and phenotypic variance:
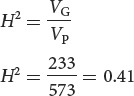
This value implies that 41% of the variation in spotting of guinea pigs in Wright’s population was due to differences in genotype.
Estimating heritability with this method assumes that the environmental variance of genetically identical individuals is the same as the environmental variance of the genetically variable individuals, which may not be true. Additionally, this approach can be applied only to organisms for which it is possible to create genetically identical individuals. ![]() TRY PROBLEM 32
TRY PROBLEM 32
Heritability By Parent-Offspring Regression
Another method for estimating heritability is to compare the phenotypes of parents and offspring. When genetic differences are responsible for phenotypic variance, offspring should resemble their parents more than they resemble unrelated individuals, because offspring and parents have some genes in common that help determine their phenotype. Correlation and regression can be used to analyze the association of phenotypes in different individuals.
To calculate the narrow-sense heritability in this way, we first measure the characteristic on a series of parents and offspring. The data are arranged into families, and the mean parental phenotype is plotted against the mean offspring phenotype (Figure 24.17). Each data point in the graph represents one family; the value on the x (horizontal) axis is the mean phenotypic value of the parents in a family, and the value on the y (vertical) axis is the mean phenotypic value of the offspring for the family.
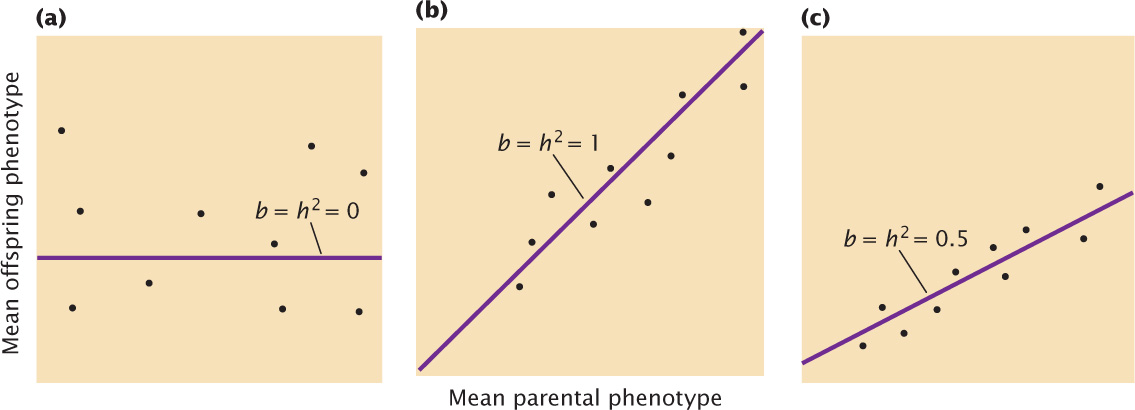
Let’s assume that there is no narrow-sense heritability for the characteristic (h2 = 0), meaning that genetic differences do not contribute to the phenotypic differences among individuals. In this case, offspring will be no more similar to their parents than they are to unrelated individuals, and the data points will be scattered randomly, generating a regression coefficient of zero (see Figure 24.17a). Next, let’s assume that all of the phenotypic differences are due to additive genetic differences (h2 = 1.0). In this case, the mean phenotype of the offspring will be equal to the mean phenotype of the parents, and the regression coefficient will be 1 (see Figure 24.17b). If genes and environment both contribute to the differences in phenotype, both heritability and the regression coefficient will lie between 0 and 1 (see Figure 24.17c). The regression coefficient therefore provides information about the magnitude of the heritability.
A complex mathematical proof (which we will not go into here) demonstrates that, in a regression of the mean phenotype of the offspring against the mean phenotype of the parents, narrow-sense heritability (h2) equals the regression coefficient (b):

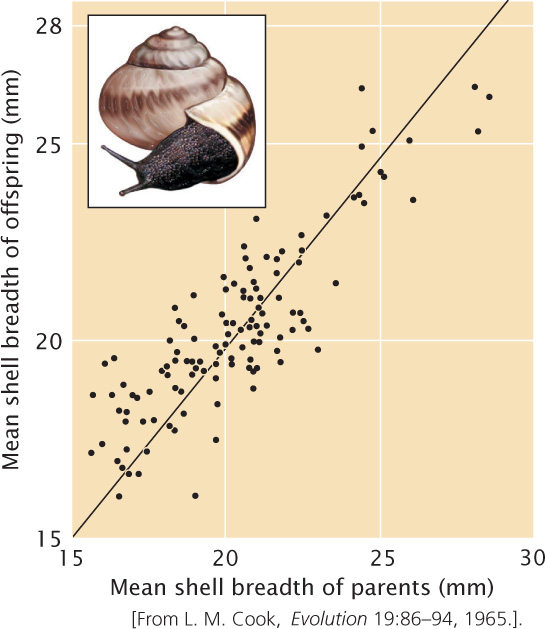
An example of calculating heritability by regression of the phenotypes of parents and offspring is illustrated in Figure 24.18.
Sometimes, only the phenotype of one parent is known. In a regression of the mean offspring phenotype against the phenotype of only one parent, the narrow-sense heritability equals twice the regression coefficient:

With only one parent, the heritability is twice the regression coefficient because only half the genes of the offspring come from one parent; thus, we must double the regression coefficient to obtain the full heritability.
700
Heritability and Degrees of Relatedness
A third method for calculating heritability is to compare the phenotypes of individuals with different degrees of relatedness. This method is based on the concept that the more closely related two individuals are, the more genes they have in common.
Monozygotic (identical) twins have 100% of their genes in common, whereas dizygotic (nonidentical) twins have, on average, 50% of their genes in common. If genes are important in determining variability in a characteristic, then monozygotic twins should be more similar in a particular characteristic than dizygotic twins. By using correlation to compare the phenotypes of monozygotic and dizygotic twins, we can estimate broad-sense heritability. A rough estimate of the broad-sense heritability can be obtained by taking twice the difference of the correlation coefficients for a quantitative characteristic in monozygotic and dizygotic twins:

where rMZ equals the correlation coefficient among monozygotic twins and rDZ equals the correlation coefficient among dizygotic twins. For example, suppose we found the correlation of height among the two members of monozygotic twin pairs (rMZ) to be 0.9 and the correlation of height among the two members of dizygotic twins (rDZ) to be 0.5. The broad-sense heritability for height would be H2 = 2(0.9 − 0.5) = 2(0.4) = 0.8. This calculation assumes that the two individuals of a monozygotic twin pair experience environments that are no more similar to each other than those experienced by the two individuals of a dizygotic twin pair. This assumption is often not met when twins have been reared together.
Narrow-sense heritability also can be estimated by comparing the phenotypic variances for a characteristic in full siblings (who have both parents in common as well as an average of 50% of their genes) and half siblings (who have only one parent in common and thus an average of 25% of their genes).
All estimates of heritability depend on the assumption that the environments of related individuals are not more similar than those of unrelated individuals. This assumption is difficult to meet in human studies, because related people are usually reared together. Heritability estimates for humans should therefore always be viewed with caution. ![]() TRY PROBLEM 36
TRY PROBLEM 36
CONCEPTS
Broad-sense heritability is the proportion of phenotypic variance that is due to genetic variance. Narrow-sense heritability is the proportion of phenotypic variance that is due to additive genetic variance. Heritability can be measured by eliminating one of the variance components, by analyzing parent–offspring regression, or by comparing individuals with different degrees of relatedness.
 CONCEPT CHECK 5
If the environmental variance (VE) increases and all other variance components remain the same, what will the effect be?
- Broad-sense heritability will decrease.
- Broad-sense heritability will increase.
- Narrow-sense heritability will increase.
- Broad-sense heritability will increase, but narrow-sense heritability will decrease.
The Limitations of Heritability
Knowledge of heritability has great practical value because it allows us to statistically predict the phenotypes of offspring on the basis of their parent’s phenotype. It also provides useful information about how characteristics will respond to selection (see Section 24.4). In spite of its importance, heritability is frequently misunderstood. It does not provide information about an individual’s genes or the environmental factors that control the development of a characteristic, and it says nothing about the nature of differences between groups. This section outlines some limitations and common misconceptions concerning broad- and narrow-sense heritability.
Heritability Does Not Indicate the Degree to Which a Characteristic is Genetically Determined
Heritability is the proportion of the phenotypic variance that is due to genetic variance; it says nothing about the degree to which genes determine a characteristic. Heritability indicates only the degree to which genes determine variation in a characteristic. The determination of a characteristic and the determination of variation in a characteristic are two very different things.
Consider polydactyly (the presence of extra digits) in rabbits, which can be caused either by environmental factors or by a dominant gene. Suppose that we have a group of rabbits all homozygous for a gene that produces the usual numbers of digits. None of the rabbits in this group carries a gene for polydactyly, but a few of the rabbits are polydactylous because of environmental factors. Broad-sense heritability for polydactyly in this group is zero, because there is no genetic variation for polydactyly; all of the variation is due to environmental factors. However, it would be incorrect for us to conclude that genes play no role in determining the number of digits in rabbits. Indeed, we know that there are specific alleles that can produce extra digits (though these alleles are not present in the group of rabbits under consideration). Heritability indicates nothing about whether genes control the development of a characteristic; it provides information only about causes of the variation in a characteristic within a defined group.
701
An Individual Does Not Have Heritability
Broad- and narrow-sense heritabilities are statistical values based on the genetic and phenotypic variances found in a group of individuals. Heritability cannot be calculated for an individual, and heritability has no meaning for a specific individual. Suppose that we calculate the narrow-sense heritability of adult body weight for the students in a biology class and obtain a value of 0.6. We could conclude that 60% of the variation in adult body weight among the students in this class is determined by additive genetic variation. We should not, however, conclude that 60% of any particular student’s body weight is due to additive genes.
There is no Universal Heritability for a Characteristic
The value of heritability for a characteristic is specific for a given population in a given environment. Recall that broad-sense heritability is genetic variance divided by phenotypic variance. Genetic variance depends on which alleles are present, which often differs between populations. In the example of polydactyly in rabbits, there were no alleles for polydactyly in the group, so the heritability of the characteristic was zero. A different group of rabbits might contain many alleles for polydactyly, and the heritability of the characteristic might then be high.
Environmental differences can also affect heritability because VP is composed of both genetic and environmental variance. When the environmental differences that affect a characteristic differ between two groups, the heritabilities for the two groups also often differ.
Because heritability is specific to a defined population in a given environment, it is important not to extrapolate heritabilities from one population to another. For example, human height is determined by environmental factors (such as nutrition and health) and by genes. If we measured the heritability of height in a developed country, we might obtain a value of 0.8, indicating that the variation in height in this population is largely genetic. This population has a high heritability because most people have adequate nutrition and health care (VE is low), so most of the phenotypic variation in height is genetically determined. It would be incorrect for us to assume that height has a high heritability in all human populations. In developing countries, there may be more variation in a range of environmental factors; some people may enjoy good nutrition and health, whereas others may have a diet deficient in protein and suffer from diseases that affect stature. If we measured the heritability of height in such a country, we would undoubtedly obtain a lower value than we observed in the developed country because there is more environmental variation and the genetic variance in height constitutes a smaller proportion of the phenotypic variation, making the heritability lower. The important point to remember is that heritability must be calculated separately for each population and each environment.
Even When Heritability is High, Environmental Factors can Influence a Characteristic
High heritability does not mean that environmental factors cannot influence the expression of a characteristic. High heritability indicates only that the environmental variation to which the population is currently exposed is not responsible for variation in the characteristic. Let’s look again at human height. In most developed countries, the heritability of human height is high, indicating that genetic differences are responsible for most of the variation in height. It would be wrong for us to conclude that human height cannot be changed by the alteration of the environment. Indeed, height decreased in several European cities during World War II owing to hunger and disease, and height can be increased dramatically by the administration of growth hormone to children. The absence of environmental variation in a characteristic does not mean that the characteristic will not respond to environmental change.
Heritabilities Indicate Nothing About the Nature of Population Differences in a Characteristic
A common misconception about heritability is that it provides information about population differences in a characteristic. Heritability is specific for a given population in a given environment, so it cannot be used to draw conclusions about why populations differ in a characteristic.
Suppose that we measured heritability for human height in two groups. One group is from a small town in a developed country, where everyone consumes a high-protein diet. Because there is little variation in the environmental factors that affect human height and there is some genetic variation, the heritability of height in this group is high. The second group comprises the inhabitants of a single village in a developing country. The consumption of protein by these people is only 25% of that consumed by those in the first group, so their average adult height is several centimeters less than that in the developed country. Again, there is little variation in the environmental factors that determine height in this group, because everyone in the village eats the same types of food and is exposed to the same diseases. Because there is little environmental variation and there is some genetic variation, the heritability of height in this group also is high.
Thus, the heritability of height in both groups is high, and the average height in the two groups is considerably different. We might be tempted to conclude that the difference in height between the two groups is genetically based—that the people in the developed country are genetically taller than the people in the developing country. This conclusion is obviously wrong, however, because these differences in height are due largely to diet—an environmental factor. Heritability provides no information about the causes of differences between populations.
702
These limitations of heritability have often been ignored, particularly in arguments about the possible social implications of genetic differences between humans. Soon after Mendel’s principles of heredity were rediscovered, some geneticists began to claim that many human behavioral characteristics are determined entirely by genes. This claim led to debates about whether characteristics such as human intelligence are determined by genes or environment. Many of the early claims of genetically based human behavior were based on poor research; unfortunately, the results of these studies were often accepted at face value and led to a number of eugenic laws that discriminated against certain groups of people. Today, geneticists recognize that many behavioral characteristics are influenced by a complex interaction of genes and environment, and separating genetic effects from those of the environment is very difficult.
The results of a number of modern studies indicate that human intelligence as measured by IQ and other intelligence tests has a moderately high heritability (usually from 0.4 to 0.8). On the basis of this observation, some people have argued that intelligence is innate and that enhanced educational opportunities cannot boost intelligence. This argument is based on the misconception that, when heritability is high, changing the environment will not alter the characteristic. In addition, because heritabilities of intelligence range from 0.4 to 0.8, a considerable amount of the variance in intelligence originates from environmental differences.
Another argument based on a misconception about heritability is that ethnic differences in measures of intelligence are genetically based. Because the results of some genetic studies show that IQ has moderately high heritability and other studies find differences in the average IQ of ethnic groups, some people have suggested that ethnic differences in IQ are genetically based. As in the example of the effects of diet on human height, heritability provides no information about causes of differences among groups; it indicates only the degree to which phenotypic variance within a single group is genetically based. High heritability for a characteristic does not mean that phenotypic differences between ethnic groups are genetic. We should also remember that separating genetic and environmental effects in humans is very difficult, so heritability estimates themselves may be unreliable. ![]() TRY PROBLEM 35
TRY PROBLEM 35
CONCEPTS
Heritability provides information only about the degree to which variation in a characteristic is genetically determined. There is no universal heritability for a characteristic; heritability is specific for a given population in a specific environment. Environmental factors can potentially affect characteristics with high heritability, and heritability says nothing about the nature of population differences in a characteristic.
CONCEPT CHECK 6
Suppose that you just learned that the narrow-sense heritability of blood pressure measured among a group of African Americans in Detroit, Michigan, is 0.4. What does this heritability tell us about genetic and environmental contributions to blood pressure?
Locating Genes That Affect Quantitative Characteristics
The statistical methods described for use in analyzing quantitative characteristics can be used both to make predictions about the average phenotype expected in offspring and to estimate the overall contribution of genes to variation in the characteristic. These methods do not, however, allow us to identify and determine the influence of individual genes that affect quantitative characteristics. As discussed in the introduction to this chapter, chromosome regions with genes that control polygenic characteristics are referred to as quantitative trait loci. Although quantitative genetics has made important contributions to basic biology and to plant and animal breeding, the past inability to identify QTLs and measure their individual effects severely limited the application of quantitative genetic methods.
Mapping QTLs
In recent years, numerous genetic markers have been identified and mapped with the use of molecular techniques, making it possible to identify QTLs by linkage analysis. The underlying idea is simple: if the inheritance of a genetic marker is associated consistently with the inheritance of a particular characteristic (such as increased height), then that marker must be linked to a QTL that affects height. The key is to have enough genetic markers so that QTLs can be detected throughout the genome. With the introduction of restriction fragment length polymorphisms, microsatellite variations, and single-nucleotide polymorphisms (SNPs; see Chapters 19 and 20), variable markers are now available for mapping QTLs in a number of different organisms (Figure 24.19).
703
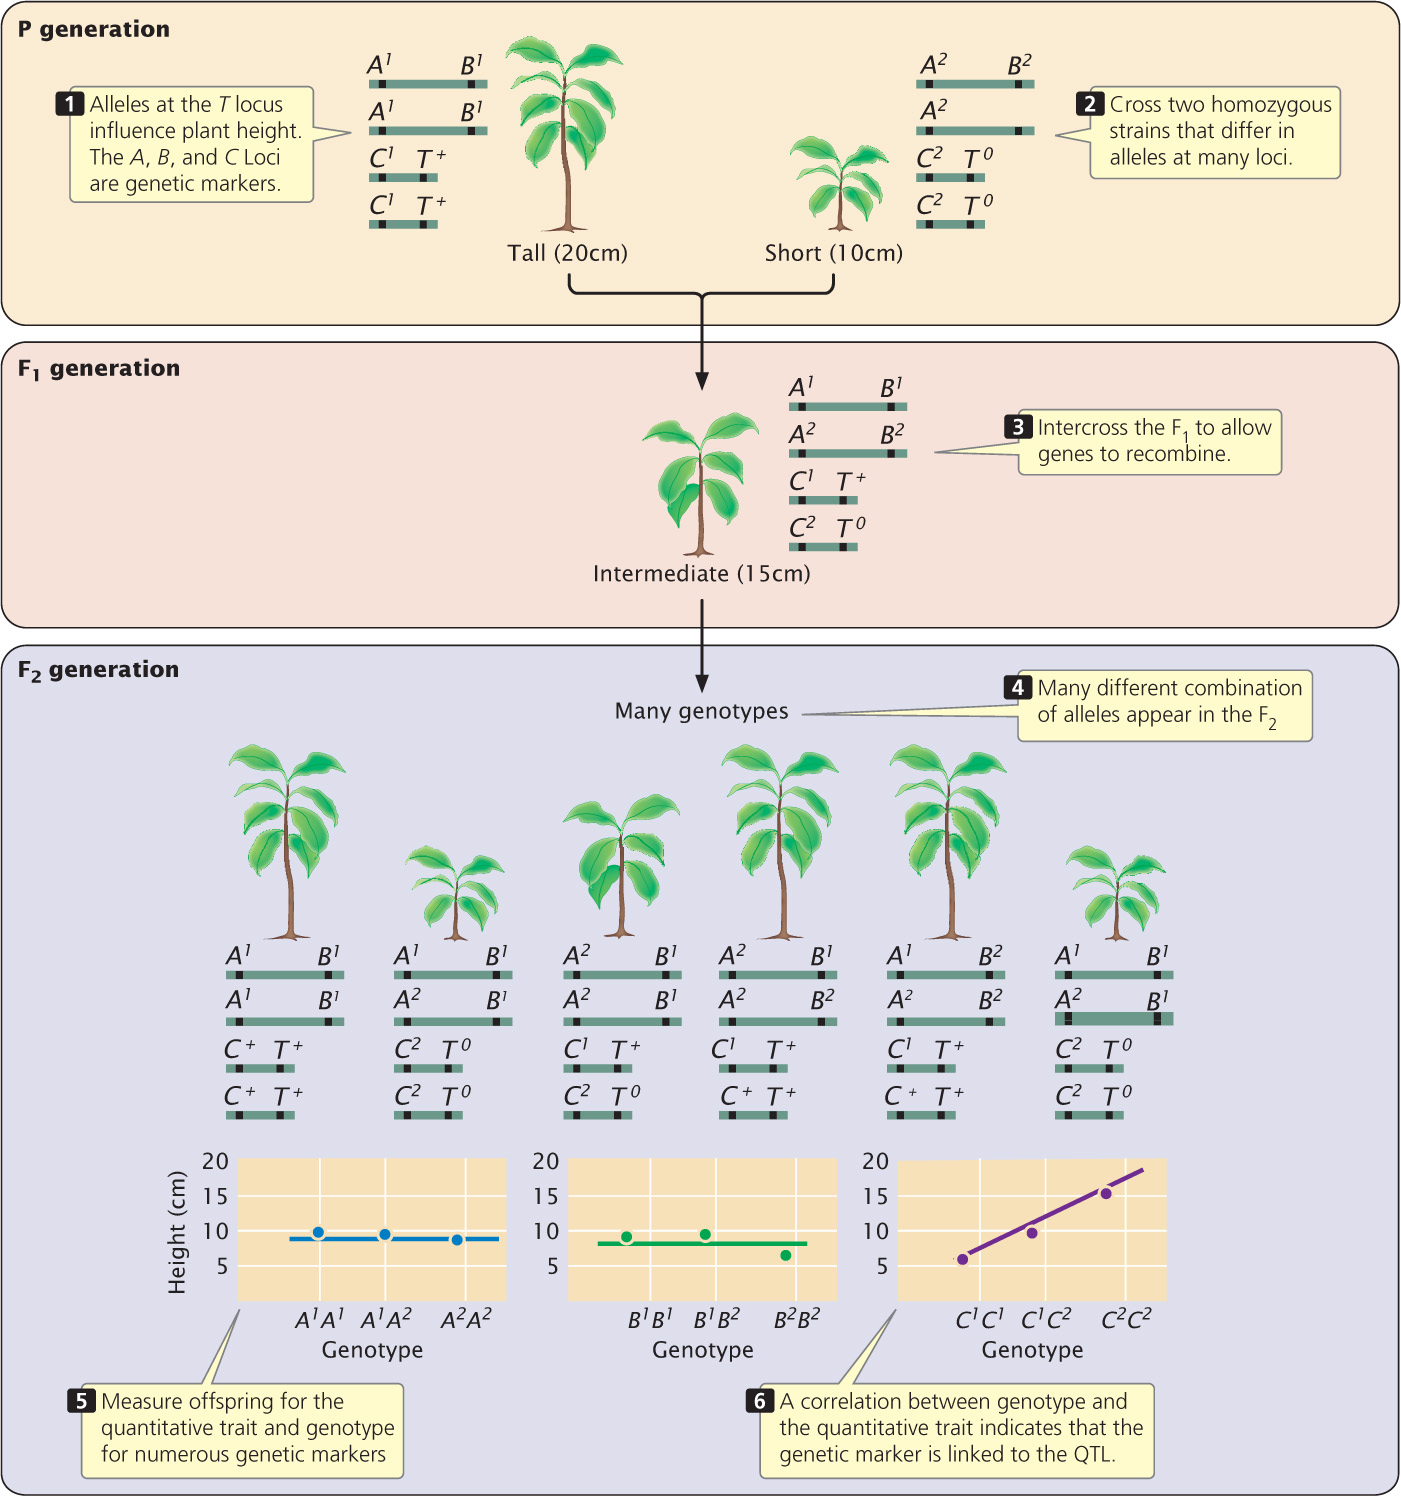
A common procedure for mapping QTLs is to cross two homozygous strains that differ in alleles at many loci (Figure 24.20). The resulting F1 progeny are then intercrossed or backcrossed to allow the genes to recombine through independent assortment and crossing over. Genes on different chromosomes and genes that are far apart on the same chromosome will recombine freely; genes that are closely linked will be inherited together. The offspring are measured for one or more quantitative characteristics; at the same time, they are genotyped for numerous genetic markers that span the genome. Any correlation between the inheritance of a particular marker allele and a quantitative phenotype indicates that a QTL is linked to that marker. If enough markers are used, the detection of all the QTLs affecting a characteristic is theoretically possible. It is important to recognize that a QTL is not a gene; rather, it is a map location for a chromosome region that is associated with that trait. After a QTL has been identified, it can be studied for the presence of one or more specific genes or other sequences that influence the quantitative trait. The introduction to this chapter describes how this approach was used to identify a major gene that affects oil production in corn. QTL mapping has been used to detect genes affecting a variety of characteristics in plant and animal species (Table 24.2).
704
| Organism | Quantitative Characteristic |
|---|---|
| tomato | Soluble solids Fruit mass Fruit pH Growth Leaflet shape Height |
| Corn | Height Leaf length Tiller number Glume hardness Grain yield Number of ears Thermotolerance |
| Common bean | Number of nodules |
| Mung bean | Seed weight |
| Cow pea Wheat | Seed weight Preharvest sprout |
| Pig | Growth Length of small intestine Average back fat Abdominal fat |
| Mouse | Epilepsy |
| Rat | Hypertension |
Source: After S. D. tanksley, Mapping polygenes, Annual Review of Genetics 27:218, 1993.
Genomewide Association Studies
The traditional method of identifying QTLs is to carry out crosses between varieties that differ in a quantitative trait and then genotype numerous progeny for many markers. Although effective, this method is slow and labor intensive.
An alternative technique for identifying genes that affect quantitative traits is to conduct genomewide association studies, which were introduced in Chapter 7. Unlike traditional linkage analysis, which examines the association of a trait and gene markers among the progeny of a cross, genomewide association studies look for associations between traits and genetic markers in a biological population, a group of interbreeding individuals. The presence of an association between genetic markers and a trait indicates that the genetic markers are closely linked to one or more genes that affect variation in the trait. Genomewide association studies have been facilitated by the identification of single-nucleotide polymorphisms, which are positions in the genome where individual organisms vary in a single base pair (see Chapter 20). Many SNPs have been identified in organisms through genomic sequencing. Individual organisms can often be quickly and inexpensively genotyped for numerous SNPs, providing the genetic markers necessary to conduct genomewide association studies.
Genomewide association studies have been widely used to locate genes that affect quantitative traits in humans, including disease susceptibility, obesity, intelligence, and height. A number of quantitative traits in plants have also been studied, including kernel composition, size, color and taste, disease resistance, and starch quality. Genomewide association studies in domestic animals have identified chromosomal segments affecting body weight, body composition, reproductive traits, hormone levels, hair characteristics, and behaviors.
CONCEPTS
The availability of numerous genetic markers revealed by molecular methods makes it possible to map chromosome segments containing genes that contribute to polygenic characteristics. Genomewide association studies locate genes that affect quantitative traits by detecting associations between genetic markers and a trait within a population of individuals.