24.4 Genetically Variable Traits Change in Response to Selection
Evolution is genetic change taking place among members of a population with the passage of time. Several different forces are potentially capable of bringing about evolution, and we will explore these forces and the process of evolution more fully in Chapter 25. Here, we consider how one of these forces—natural selection—can bring about genetic change in a quantitative characteristic.
Charles Darwin proposed the idea of natural selection in his book On the Origin of Species in 1859. Natural selection arises through the differential reproduction of individuals with different genotypes. Because of the genes that they possess, some individuals produce more offspring than others. The more-successful reproducers give rise to more offspring, which inherit the genes that confer a reproductive advantage. Thus, the frequencies of the genes that confer a reproductive advantage increase with the passage of time and the population evolves. Natural selection is among the most important of the forces that bring about evolutionary change. Through natural selection, organisms become genetically suited to their environments; as environments change, groups of organisms change in ways that make them better able to survive and reproduce.
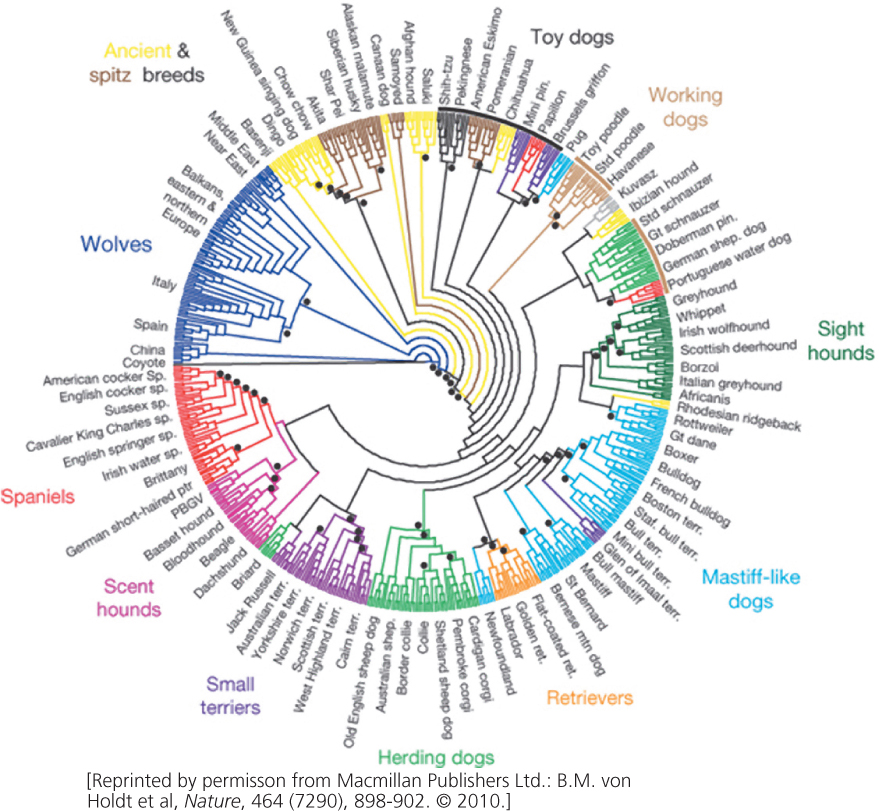
For thousands of years, humans have practiced a form of selection by promoting the reproduction of organisms with traits perceived as desirable. This form of selection is artificial selection, and it has produced the domestic plants and animals that make modern agriculture possible. The power of artificial selection, the first application of genetic principles by humans, is illustrated by the tremendous diversity of shapes, colors, and behaviors of modern domesticated dogs (Figure 24.21).
705
Predicting the Response to Selection
When a quantitative characteristic is subjected to natural or artificial selection, it frequently changes with the passage of time, provided that there is genetic variation for that characteristic in the population. Suppose that a dairy farmer wants to increase milk production among the cows in his herd. Variation at several loci potentially affects milk production in cows; some alleles at these loci confer high milk production whereas other alleles confer low milk production. The dairy farmer breeds only those cows in his herd that have the highest milk production. If there is genetic variation in milk production (i.e., there are different alleles at the loci that control milk production), the mean milk production in the offspring of the selected cows should be higher than the mean milk production of the original herd. This increased production is due to the fact that the selected cows possess more alleles for high milk production than does the average cow, and these alleles are passed on to the offspring. The offspring of the selected cows possess a higher proportion of alleles for greater milk yield and therefore produce more milk than the average cow in the initial herd.
The extent to which a characteristic subjected to selection changes in one generation is termed the response to selection. Suppose that the average cow in a dairy herd produces 80 liters of milk per week. A farmer selects for increased milk production by breeding the highest milk producers, and the progeny of these selected cows produce 100 liters of milk per week on average. The response to selection is calculated by subtracting the mean phenotype of the original population (80 liters) from the mean phenotype of the offspring (100 liters), obtaining a response to selection of 100 − 80 = 20 liters per week.
Factors Influencing Response To Selection
The response to selection is determined primarily by two factors. First, it is affected by narrow-sense heritability, which largely determines the degree of resemblance between parents and offspring. When the narrow-sense heritability is high, offspring will tend to resemble their parents; conversely, when the narrow-sense heritability is low, there will be little resemblance between parents and offspring.
The second factor that determines the response to selection is how much selection there is. If the farmer is very stringent in the choice of parents and breeds only the highest milk producers in the herd (say, the top two cows), then all the offspring will receive genes for high-quality milk production. If the farmer is less selective and breeds the top 20 milk producers in the herd, then the offspring will not carry as many superior genes for high milk production, and on average they will not produce as much milk as the offspring of the top two producers. The response to selection depends on the phenotypic difference of the individuals that are selected as parents; this phenotypic difference is measured by the selection differential, defined as the difference between the mean phenotype of the selected parents and the mean phenotype of the original population. If the average milk production of the original herd is 80 liters and the farmer breeds cows with an average milk production of 120 liters, then the selection differential is 120 − 80 = 40 liters.
Calculation Of Response To Selection
The response to selection (R) depends on the narrow-sense heritability (h2) and the selection differential (S):

This equation can be used to predict the magnitude of change in a characteristic when a given selection differential is applied. G. A. Clayton and his colleagues estimated the response to selection that would take place in the abdominal bristle number of Drosophila melanogaster. By using several different methods, including parent-offspring regression, they first estimated the narrow-sense heritability of the abdominal bristle number in one population of fruit flies to be 0.52. The mean number of bristles in the original population was 35.3. They selected individual flies with a mean bristle number of 40.6 and intercrossed them to produce the next generation. The selection differential was 40.6 − 35.3 = 5.3; so they predicted a response to selection to be
706
R = 0.52 × 5.3 = 2.8
The response to selection of 2.8 is the expected increase in the characteristic of the offspring above the mean of the original population. They therefore expected the average number of abdominal bristles in the offspring of their selected flies to be 35.3 + 2.8 = 38.1. Indeed, they found an average bristle number of 37.9 in these flies.
Estimating Heritability From Response To Selection
Rearranging Equation 24.21 provides another way to calculate narrow-sense heritability:
In this way, h2 can be calculated by conducting a response-to-selection experiment. First, the selection differential is obtained by subtracting the population mean from the mean of selected parents. The selected parents are then interbred, and the mean phenotype of their offspring is measured. The difference between the mean of the offspring and that of the initial population is the response to selection, which can be used with the selection differential to estimate heritability. Heritability determined by a response-to-selection experiment is usually termed the realized heritability. If certain assumptions are met, the realized heritability is identical with the narrow-sense heritability.
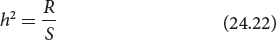
One of the longest selection experiments is a study of oil and protein content in corn seeds (Figure 24.22). This experiment began at the University of Illinois on 163 ears of corn with an oil content ranging from 4% to 6%. Corn plants with high oil content and those with low oil content were selected and interbred. Response to selection for increased oil content (the upper line in Figure 24.22) reached about 20%, whereas response to selection for decreased oil content reached a lower limit near zero. Genetic analyses of the high- and low-oil-content strains revealed that at least 20 loci take part in determining oil content, one of which we explored in the introduction to this chapter. ![]() TRY PROBLEM 40
TRY PROBLEM 40
CONCEPTS
The response to selection is influenced by narrow-sense heritability and the selection differential.
 CONCEPT CHECK 7
The narrow-sense heritability for a trait is 0.4 and the selection differential is 0.5. What is the predicted response to selection?
Limits to Selection Response
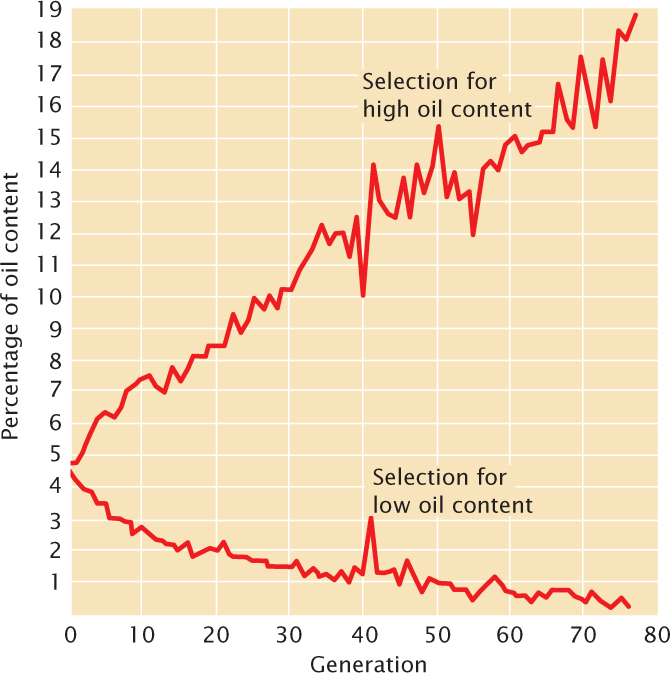
When a characteristic has been selected for many generations, the response may eventually level off, and the characteristic no longer responds to selection (Figure 24.23). A potential reason for this leveling off is that the genetic variation in the population may be exhausted; at some point, all individuals in the population have become homozygous for alleles that encode the selected trait. When there is no more additive genetic variation, heritability equals zero, and no further response to selection can take place.
Sometimes, the response to selection may level off even while some genetic variation remains in the population. This leveling off takes place because natural selection oppose further change in the characteristic. The response to selection for small body size in mice, for example, eventually levels off because the smallest animals are sterile and cannot pass on their genes for small body size. In this case, artificial selection for small size is opposed by natural selection for fertility, and the population can no longer respond to the artificial selection.
707
Correlated Responses
Often when a specific trait is selected, other traits change at the same time. This type of associated response is due to the fact that the traits are encoded by the same genes.
Two or more characteristics are often correlated. For example, in many plants, plant size and number of seeds produced exhibit a positive correlation: larger plants, on average, produce more seeds than smaller plants. This correlation is a phenotypic correlation because the association is between two phenotypes of the same individual. Phenotypic correlations may be due to environmental or genetic correlations. Environmental correlations refer to two or more characteristics that are influenced by the same environmental factor. Moisture availability, for example, may affect both the size of a plant and the number of seeds produced by the plant. Plants growing in environments with lots of water are large and produce many seeds, whereas plants growing in environments with limited water are small and have few seeds.
Alternatively, a phenotypic correlation may result from a genetic correlation, which means that the genes affecting two characteristics are associated. The primary genetic cause of phenotypic correlations is pleiotropy, which is due to the effect of one gene on two or more characteristics (see Chapter 5). In humans, for example, many body structures respond to growth hormone, and there are genes that affect the amount of growth hormone secreted by the pituitary gland. People with certain genes produce high levels of growth hormone, which increases both height and hand size. Others possess genes that produce lower levels of growth hormone, which leads to both short stature and small hands. Height and hand size are therefore phenotypically correlated in humans, and this correlation is due to a genetic correlation—the fact that both characteristics are affected by the same genes that control the amount of growth hormone. Genetically speaking, height and hand size are the same characteristic because they are the phenotypic manifestation of a single set of genes. When two characteristics are influenced by the same genes they are genetically correlated.
Genetic correlations are quite common (Table 24.3) and may be positive or negative. A positive genetic correlation between two characteristics means that genes that cause an increase in one characteristic also produce an increase in the other characteristic. Thorax length and wing length in Drosophila are positively correlated because the genes that increase thorax length also increase wing length. A negative genetic correlation means that genes that cause an increase in one characteristic produce a decrease in the other characteristic. Milk yield and percentage of butterfat are negatively correlated in cattle: genes that cause higher milk production result in milk with a lower percentage of butterfat.
| Organism | Characteristics | Genetic Correlation |
|---|---|---|
| Cattle | Milk yield and percentage of butterfat | −0.38 |
| Pig | Weight gain and back-fat thickness | 0.13 |
| Weight gain and efficiency | 0.69 | |
| Chicken | Body weight and egg weight | 0.42 |
| Body weight and egg production | −0.17 | |
| Egg weight and egg production | −0.31 | |
| Mouse | Body weight and tail length | 0.29 |
| Fruit fly | Abdominal bristle number and sternopleural bristle number | 0.41 |
| Source: After D. S. Falconer and t. F. C. Mackay. Introduction to Quantitative Genetics (Pearson, New York, 1996), p. 314. | ||
Genetic correlations are important in animal and plant breeding because they produce a correlated response to selection, which means that, when one characteristic is selected, genetically correlated characteristics also change. Correlated responses to selection are due to the fact that both characteristics are influenced by the same genes; selection for one characteristic causes a change in the genes affecting that characteristic, and these genes also affect the second characteristic, causing it to change at the same time. Correlated responses may well be undesirable and may limit the ability to alter a characteristic by selection. From 1944 to 1964, domestic turkeys were subjected to intense selection for growth rate and body size. At the same time, fertility, egg production, and egg hatchability all declined. These correlated responses were due to negative genetic correlations between body size and fertility; eventually, these genetic correlations limited the extent to which the growth rate of turkeys could respond to selection. Genetic correlations may also limit the ability of natural populations to respond to selection in the wild and adapt to their environments. ![]() TRY PROBLEM 13
TRY PROBLEM 13
CONCEPTS
Genetic correlations result from pleiotropy. When two characteristics are genetically correlated, selection for one characteristic will produce a correlated response in the other characteristic.
CONCEPT CHECK 8
In a herd of dairy cattle, milk yield and the percentage of butterfat exhibit a genetic correlation of −0.38. If greater milk yield is selected in this herd, what will be the effect on the percentage of butterfat?
708