25.4 Several Evolutionary Forces Potentially Cause Changes in Allelic Frequencies
The Hardy–Weinberg law indicates that allelic frequencies do not change as a result of reproduction. Processes that bring about change in allelic frequency include mutation, migration, genetic drift (random effects due to small population size), and natural selection.
Mutation
Before evolution can take place, genetic variation must exist within a population; consequently, all evolution depends on processes that generate genetic variation. Although new combinations of existing genes may arise through recombination in meiosis, all genetic variants ultimately arise through mutation.
The Effect of Mutation on Allelic Frequencies
Mutation can influence the rate at which one genetic variant increases at the expense of another. Consider a single locus in a population of 25 diploid individuals. Each individual possesses two alleles at the locus under consideration, so the gene pool of the population consists of 50 allele copies. Let us assume that there are two different alleles, designated G1 and G2 with frequencies p and q, respectively. If there are 45 copies of G1 and 5 copies of G2 in the population, p = 0.90 and q = 0.10. Now suppose that a mutation changes a G1 allele into a G2 allele. After this mutation, there are 44 copies of G1 and 6 copies of G2, and the frequency of G2 has increased from 0.10 to 0.12. Mutation has changed the allelic frequency.
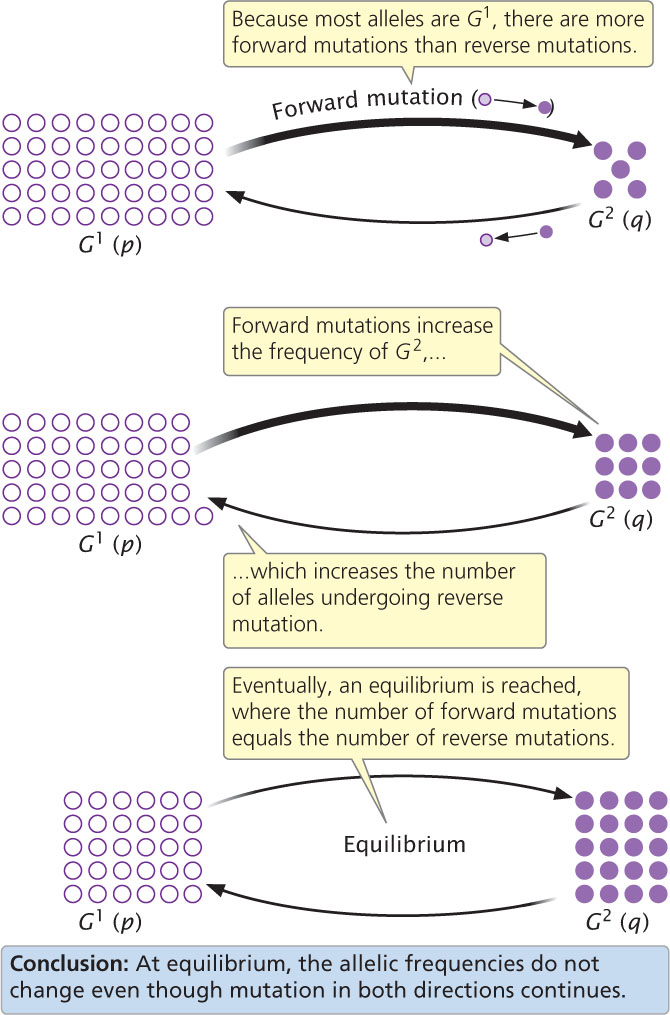
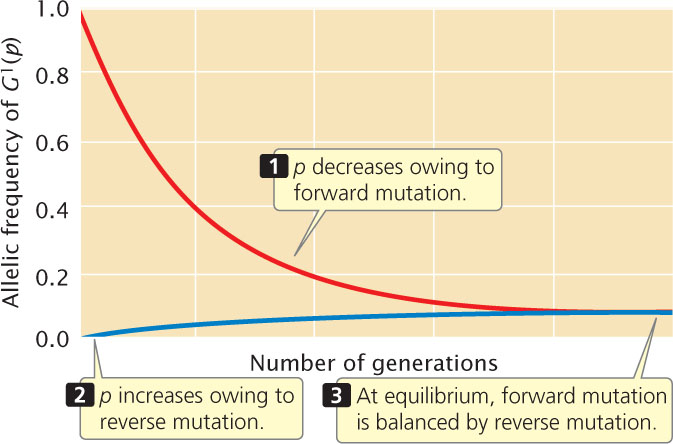
If copies of G1 continue to mutate to G2, the frequency of G2 will increase and the frequency of G1 will decrease (Figure 25.8). The amount that G2 will change (Δq) as a result of mutation depends on: (1) the rate of G1-to-G2 mutation (μ) and (2) p, the frequency of G1 in the population. When p is large, there are many copies of G1 available to mutate to G2, and the amount of change will be relatively large. As more mutations occur and p decreases, there will be fewer copies of G1 available to mutate to G2. The change in G2 as a result of mutation equals the mutation rate times the allelic frequency:

As the frequency of p decreases as a result of mutation, the change in frequency due to mutation will be less and less.
So far, we have considered only the effects of G1 → G2 forward mutations. Reverse G2 → G1 mutations also occur at rate ν, which will probably be different from the forward mutation rate, μ. Whenever a reverse mutation occurs, the frequency of G2 decreases and the frequency of G1 increases (see Figure 25.8). The rate of change due to reverse mutations equals the reverse mutation rate times the allelic frequency of G2(Δq = νq). The overall change in allelic frequency is a balance between the opposing forces of forward mutation and reverse mutation:

Reaching Equilibrium of Allelic Frequencies
Consider a population that begins with a high frequency of G1 and a low frequency of G2. In this population, many copies of G1 are initially available to mutate to G2, and the increase in G2 due to forward mutation will be relatively large. However, as the frequency of G2 increases as a result of forward mutations, fewer copies of G1 are available to mutate, so the number of forward mutations decreases. On the other hand, few copies of G2 are initially available to undergo a reverse mutation to G1 but as the frequency of G2 increases, the number of copies of G2 available to undergo reverse mutation to G1 increases; so the number of genes undergoing reverse mutation will increase. Eventually, the number of genes undergoing forward mutation will be counterbalanced by the number of genes undergoing reverse mutation. At this point, the increase in q due to forward mutation will be equal to the decrease in q due to reverse mutation, and there will be no net change in allelic frequency (Δq = 0), in spite of the fact that forward and reverse mutations continue to occur. The point at which there is no change in the allelic frequency of a population is referred to as equilibrium (see Figure 25.8). At equilibrium, the frequency of G2 ( ) will be
727
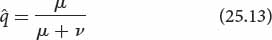
This final equation tells us that the allelic frequency at equilibrium is determined solely by the forward (μ) and reverse (ν) mutation rates. ![]() TRY PROBLEM 30
TRY PROBLEM 30
Summary of Effects
When the only evolutionary force acting on a population is mutation, allelic frequencies change with the passage of time because some alleles mutate into others. Eventually, these allelic frequencies reach equilibrium and are determined only by the forward and reverse mutation rates. When the allelic frequencies reach equilibrium, the Hardy–Weinberg law tells us that genotypic frequencies also will remain the same.
The mutation rates for most genes are low, so change in allelic frequency due to mutation in one generation is very small, and long periods of time are required for a population to reach mutational equilibrium. For example, if the forward and reverse mutation rates for alleles at a locus are 1 × 10⁻⁵ and 0.3 × 10⁻⁵ per generation, respectively (rates that have actually been measured at several loci in mice), and the allelic frequencies are p = 0.9 and q = 0.1, then the net change in allelic frequency per generation due to mutation is
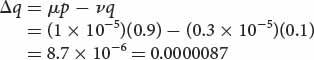
Therefore, change due to mutation in a single generation is extremely small and, as the frequency of p drops as a result of mutation, the amount of change will become even smaller (Figure 25.9). The effect of typical mutation rates on Hardy–Weinberg equilibrium is negligible, and many generations are required for a population to reach mutational equilibrium. Nevertheless, if mutation is the only force acting on a population for long periods of time, mutation rates will determine allelic frequencies.
CONCEPTS
Recurrent mutation causes changes in the frequencies of alleles. At equilibrium, the allelic frequencies are determined by the forward and reverse mutation rates. Because mutation rates are low, the effect of mutation on allelic frequencies per generation is very small.
 CONCEPT CHECK 6
When a population is in equilibrium for forward and reverse mutation rates, which of the following is true?
- The number of forward mutations is greater than the number of reverse mutations.
- No forward or reverse mutations occur.
- The number of forward mutations is equal to the number of reverse mutations.
- The population is in Hardy–Weinberg equilibrium.
Migration
Another process that may bring about change in allelic frequencies is the influx of genes from other populations, commonly called migration or gene flow. One of the assumptions of the Hardy–Weinberg law is that migration does not take place, but many natural populations do experience migration from other populations. The overall effect of migration is twofold: (1) it prevents populations from becoming genetically different from one another and (2) it increases genetic variation within populations.
The Effect of Migration on Allelic Frequencies
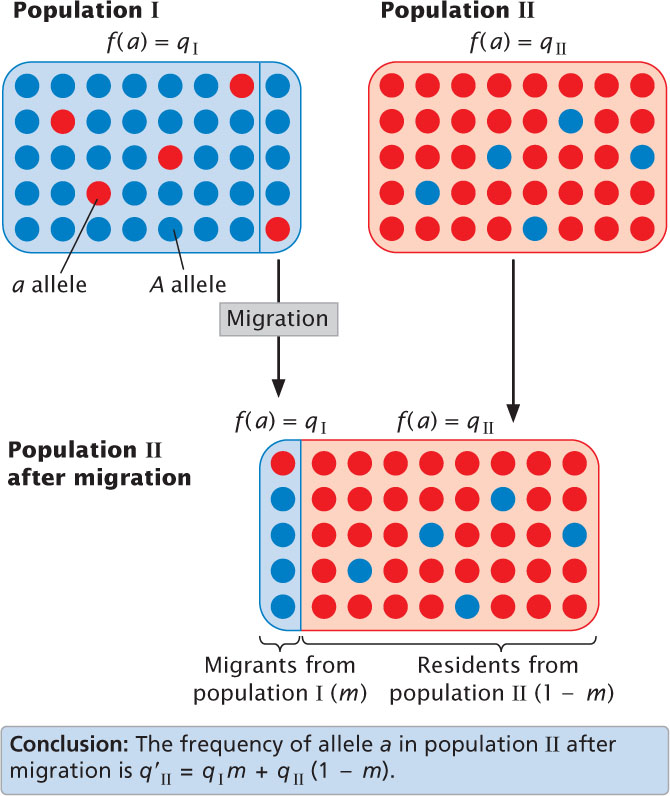
Let’s consider the effects of migration by looking at a simple, unidirectional model of migration between two populations that differ in the frequency of an allele a. Say that the frequency of this allele in population I is qI and in population II is qII (Figure 25.10). In each generation, a representative sample of the individuals in population I migrates to population II and reproduces, adding its alleles to population II’s gene pool. Migration is only from population I to population II (unidirectional), and all the conditions of the Hardy–Weinberg law (large population size, random mating, etc.) apply, except the absence of migration.
728
After migration, population II consists of two types of individuals. Some are migrants; they make up proportion m of population II, and they carry alleles from population I, so the frequency of allele a in the migrants is qI. The other individuals in population II are the original residents. If the migrants make up proportion m of population II, then the residents make up 1 − m; because the residents originated in population II, the frequency of allele a in this group is qII. After migration, the frequency of allele a in the merged population II (q′II) is

where qI(m) is the contribution to q made by the copies of allele a in the migrants and qII(1 − m) is the contribution to q made by copies of allele a in the residents. The change in the allelic frequency due to migration (Δq) will be

Equation 25.15 summarizes the factors that determine the amount of change in allelic frequency due to migration. The amount of change in q is directly proportional to the migration (m); as the amount of migration increases, the change in allelic frequency increases. The magnitude of change is also affected by the differences in allelic frequencies of the two populations (qI − qII); when the difference is large, the change in allelic frequency will be large.
With each generation of migration, the frequencies of the two populations become more and more similar until, eventually, the allelic frequency of population II equals that of population I. When qI − qII = 0, there will be no further change in the allelic frequency of population II, in spite of the fact that migration continues. If migration between two populations takes place for a number of generations with no other evolutionary forces present, an equilibrium is reached at which the allelic frequency of the recipient population equals that of the source population.
The simple model of unidirectional migration between two populations just outlined can also be expanded to accommodate multidirectional migration between several populations.
The Overall Effect of Migration
Migration has two major effects. First, it causes the gene pools of populations to become more similar. Later, we will see how genetic drift and natural selection lead to genetic differences between populations; migration counteracts this tendency and tends to keep populations homogeneous in their allelic frequencies. Second, migration adds genetic variation to populations. Different alleles may arise in different populations owing to rare mutational events, and these alleles can be spread to new populations by migration, increasing the genetic variation within the recipient population. ![]() TRY PROBLEM 34
TRY PROBLEM 34
CONCEPTS
Migration causes changes in the allelic frequency of a population by introducing alleles from other populations. The magnitude of change due to migration depends on both the extent of migration and the difference in allelic frequencies between the source and the recipient populations. Migration decreases genetic differences between populations and increases genetic variation within populations.
CONCEPT CHECK 7
Each generation, 10 random individuals migrate from population A to population B. What will happen to allelic frequency q as a result of migration when q is equal in populations A and B?
- q in A will decrease.
- q in B will increase.
- q will not change in either A or B.
- q in B will become q2.
Genetic Drift
The Hardy–Weinberg law assumes random mating in an infinitely large population; only when population size is infinite will the gametes carry genes that perfectly represent the parental gene pool. But no real population is infinitely large and when population size is limited, the gametes that unite to form individuals of the next generation carry a sample of alleles present in the parental gene pool. Just by chance, the composition of this sample will often deviate from that of the parental gene pool, and this deviation may cause allelic frequencies to change. The smaller the gametic sample, the greater the chance that its composition will deviate from that of the entire gene pool.
729
The role of chance in altering allelic frequencies is analogous to the flip of a coin. Each time we flip a coin, we have a 50% chance of getting a head and a 50% chance of getting a tail. If we flip a coin 1000 times, the observed ratio of heads to tails will be very close to the expected 50:50 ratio. If, however, we flip a coin only 10 times, there is a good chance that we will obtain not exactly five heads and five tails, but maybe seven heads and three tails or eight tails and two heads. This kind of deviation from an expected ratio due to limited sample size is referred to as sampling error.
Sampling error arises when gametes unite to produce progeny. Many organisms produce a large number of gametes but, when population size is small, a limited number of gametes unite to produce the individuals of the next generation. Chance influences which alleles are present in this limited sample and, in this way, sampling error may lead to genetic drift, or changes in allelic frequency. Because the deviations from the expected ratios are random, the direction of change is unpredictable. We can nevertheless predict the magnitude of the changes.
The Magnitude of Genetic Drift
The effect of genetic drift can be viewed in two ways. First, we can see how it influences the change in allelic frequencies of a single population with the passage of time. Second, we can see how it affects differences that accumulate among series of populations. Imagine that we have 10 small populations, all beginning with the exact same allelic frequencies of p = 0.5 and q = 0.5. When genetic drift occurs in a population, allelic frequencies within the population will change but, because drift is random, the way in which allelic frequencies change in each population will not be the same. In some populations, p may increase as a result of chance. In other populations, p may decrease as a result of chance. In time, the allelic frequencies in the 10 populations will become different: the populations will genetically diverge. As time passes, the change in allelic frequency within a population and the genetic divergence among populations are due to the same force—the random change in allelic frequencies. The magnitude of genetic drift can be assessed either by examining the change in allelic frequency within a single population or by examining the magnitude of genetic differences that accumulate among populations.
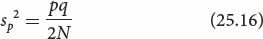
The amount of genetic drift can be estimated from the variance in allelic frequency. Variance, s2, is a statistical measure that describes the degree of variability in a trait. Suppose that we observe a large number of separate populations, each with N individuals and allelic frequencies of p and q. After one generation of random mating, genetic drift expressed in terms of the variance in allelic frequency among the populations (sp2) will be
The amount of change resulting from genetic drift (the variance in allelic frequency) is determined by two parameters: the allelic frequencies (p and q) and the population size (N). Genetic drift will be maximal when p and q are equal (each 0.5). For example, assume that a population consists of 50 individuals. When the allelic frequencies are equal (p = q = 0.5), the variance in allelic frequency (sp2) will be (0.5 × 0.5)/(2 × 50) = 0.0025. In contrast, when p = 0.9 and q = 0.1, the variance in allelic frequency will be only 0.0009. Genetic drift will also be higher when the population size is small. If p = q = 0.5, but the population size is only 10 instead of 50, then the variance in allelic frequency becomes (0.5 × 0.5)/(2 × 10) = 0.0125, which is five times as great as when population size is 50.
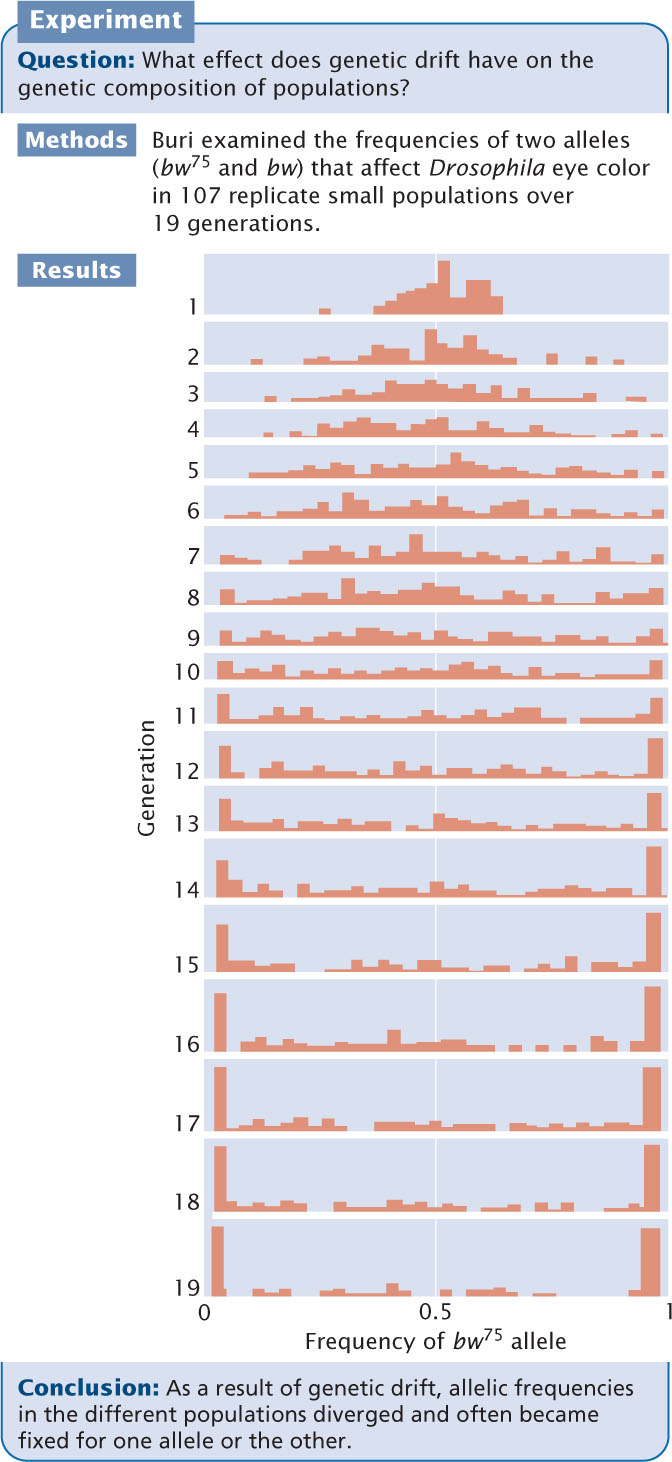
This divergence of populations through genetic drift is strikingly illustrated in the results of an experiment carried out by Peter Buri on fruit flies (Figure 25.11). Buri examined the frequencies of two alleles (bw75 and bw) that affect eye color in fruit flies. He set up 107 populations, each consisting of eight males and eight females. He began each population with a frequency of bw75 equal to 0.5. He allowed the flies within each replicate to mate randomly and, each generation, he randomly selected eight male and eight female flies to be the parents of the next generation. He followed the changes in the frequencies of the two alleles over 19 generations. In one population, the average frequency of bw75 (p) over the 19 generations was 0.5312. We can use Equation 25.16 to calculate the expected variance in allelic frequency due to genetic drift. The frequency of the bw allele (q) will be 1 − p = 1 − 0.53125 = 0.46875. The population size (N) equals 16. The expected variance in allelic frequency will be
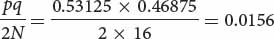
which was very close to the actual observed variance of 0.0151.
The effect of population size on genetic drift is illustrated by a study conducted by Luca Cavalli-Sforza and his colleagues. They studied variation in blood types among villagers in the Parma Valley of Italy, where the amount of migration between villages was limited. They found that variation in allelic frequency was greatest between small isolated villages in the upper valley but decreased between larger villages and towns farther down the valley. This result is exactly what we expect with genetic drift: there should be more genetic drift and thus more variation among villages when population size is small.
730
For ecological and demographic studies, population size is usually defined as the number of individuals in a group. However, the evolution of a gene pool depends only on those individuals who contribute genes to the next generation. Population geneticists usually define population size as the equivalent number of breeding adults, the effective population size (Ne). Several factors determine the equivalent number of breeding adults, including the sex ratio, variation between individuals in reproductive success, fluctuations in population size, the age structure of the population, and whether mating is random.
CONCEPTS
Genetic drift is change in allelic frequency due to chance factors. The amount of change in allelic frequency due to genetic drift is inversely related to the effective population size (the equivalent number of breeding adults in a population).
CONCEPT CHECK 8
Which of the following statements is an example of genetic drift?
- Allele g for fat production increases in a small population because birds with more body fat have higher survivorship in a harsh winter.
- Random mutation increases the frequency of allele A in one population but not in another.
- Allele R reaches a frequency of 1.0 because individuals with genotype rr are sterile.
- Allele m is lost when a virus kills all but a few individuals and just by chance none of the survivors possess allele m.
Causes of Genetic Drift
All genetic drift arises from sampling error, but there are several different ways in which sampling error can arise. First, a population may be reduced in size for a number of generations because of limitations in space, food, or some other critical resource. Genetic drift in a small population for multiple generations can significantly affect the composition of a population’s gene pool.
A second way that sampling error can arise is through the founder effect, which is due to the establishment of a population by a small number of individuals; the population of bighorn sheep at the National Bison Range, discussed in the introduction to this chapter, underwent a founder effect. Although a population may increase and become quite large, the genes carried by all its members are derived from the few genes originally present in the founders (assuming no migration or mutation). Chance events affecting which genes were present in the founders will have an important influence on the makeup of the entire population.
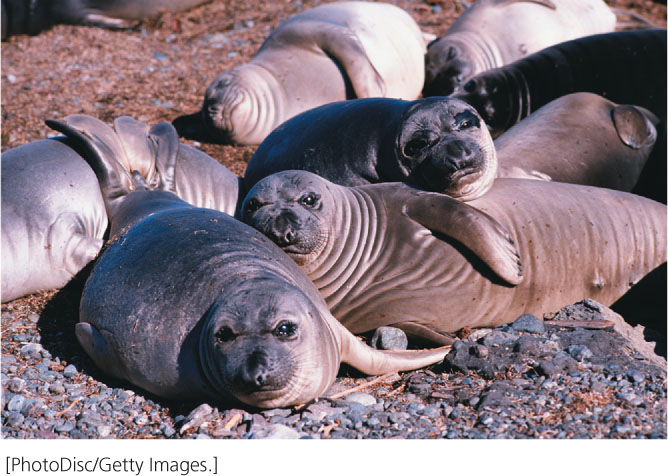
A third way in which genetic drift arises is through a genetic bottleneck, which develops when a population undergoes a drastic reduction in population size. An example is seen in northern elephant seals (Figure 25.12). Before 1800, thousands of northern elephant seals were found along the California coast, but hunting between 1820 and 1880 devastated the population. By 1884, as few as 20 seals survived on a remote beach of Isla de Guadalupe west of Baja California, Mexico. Restrictions on hunting enacted by the United States and Mexico allowed the seals to recover, and there are now more than 30,000 seals in the population. All seals in the population today are genetically similar, because they have genes that were carried by the few survivors of the population bottleneck.
731
The Effects of Genetic Drift
Genetic drift has several important effects on the genetic composition of a population. First, it produces change in allelic frequencies within a population. Because drift is random, allelic frequency is just as likely to increase as it is to decrease and will wander with the passage of time (hence the name genetic drift). Figure 25.13 illustrates a computer simulation of genetic drift in five populations over 30 generations, starting with q = 0.5 and maintaining a constant population size of 10 males and 10 females. These allelic frequencies change randomly from generation to generation.
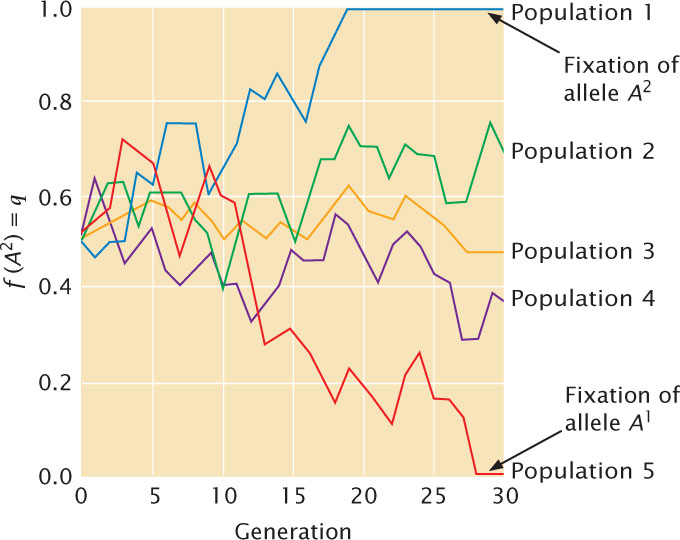
A second effect of genetic drift is to reduce genetic variation within populations. Through random change, an allele may eventually reach a frequency of either 1 or 0, at which point all individuals in the population are homozygous for one allele. When an allele has reached a frequency of 1, we say that it has reached fixation. Other alleles are lost (reach a frequency of 0) and can be restored only by migration from another population or by mutation. Fixation, then, leads to a loss of genetic variation within a population. This loss can be seen in the northern elephant seals just described. Today, these seals have low levels of genetic variation; a study of 24 protein-encoding genes found no individual or population differences in these genes. A subsequent study of sequence variation in mitochondrial DNA also revealed low levels of genetic variation. In contrast, southern elephant seals had much higher levels of mitochondrial DNA variation. Southern elephant seals, which are found in Antarctica and sub-Antarctic waters, also were hunted, but their population size never dropped below 1000; therefore, unlike the northern elephant seals, they did not experience a genetic bottleneck.
Given enough time, all small populations will become fixed for one allele or the other. Which allele becomes fixed is random and is determined by the initial frequency of the allele. If a population begins with two alleles, each with a frequency of 0.5, both alleles have an equal probability of fixation. However, if one allele is initially common, it is more likely to become fixed.
A third effect of genetic drift is that different populations diverge genetically with time. In Figure 25.13, all five populations begin with the same allelic frequency (q = 0.5) but, because drift is random, the frequencies in different populations do not change in the same way, and so populations gradually acquire genetic differences. Eventually, all the populations will reach fixation; some will become fixed for one allele, and others will become fixed for the alternative allele.
The three results of genetic drift (allelic frequency change, loss of variation within populations, and genetic divergence between populations) take place simultaneously, and all result from sampling error. The first two results take place within populations, whereas the third takes place between populations. ![]() TRY PROBLEM 35
TRY PROBLEM 35
CONCEPTS
Genetic drift results from continuous small population size, the founder effect (establishment of a population by a few founders), and the bottleneck effect (population reduction). Genetic drift causes a change in allelic frequencies within a population, a loss of genetic variation through the fixation of alleles, and genetic divergence between populations.
Natural Selection
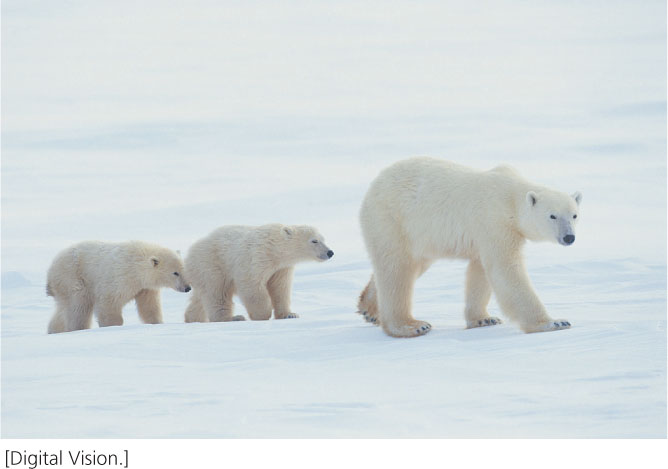
A final process that brings about changes in allelic frequencies is natural selection, the differential reproduction of genotypes. Natural selection takes place when individuals with adaptive traits produce a greater number of offspring than that produced by others in the population. If the adaptive traits have a genetic basis, they are inherited by the offspring and appear with greater frequency in the next generation. A trait that provides a reproductive advantage thereby increases with the passage of time, enabling populations to become better suited to their environments—better adapted. Natural selection is unique among evolutionary forces in that it promotes adaptation (Figure 25.14).
732
Fitness and the Selection Coefficient
The effect of natural selection on the gene pool of a population depends on the fitness values of the genotypes in the population. Fitness is defined as the relative reproductive success of a genotype. Here, the term relative is critical: fitness is the reproductive success of one genotype compared with the reproductive successes of other genotypes in the population.
Fitness (W) ranges from 0 to 1. Suppose the average number of viable offspring produced by three genotypes is
| Genotypes: | AlAl | AlA2 | A2A2 |
| Mean number of offspring produced: | 10 | 5 | 2 |
To calculate fitness for each genotype, we take the mean number of offspring produced by a genotype and divide it by the mean number of offspring produced by the most prolific genotype:
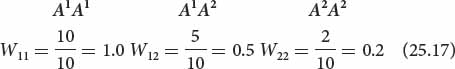
The fitness of genotype A1A1 is designated W11, that of A1A2 is W12, and that of A2A2 is W22. A related variable is the selection coefficient (s), which is the relative intensity of selection against a genotype. We usually speak of selection for a particular genotype, but keep in mind that, when selection is for one genotype, selection is automatically against at least one other genotype. The selection coefficient is equal to 1 − W; so the selection coefficients for the preceding three genotypes are
| A1A1 | A1A2 | A2A2 | |
| Selection coefficient (1 − W): | s11 = 0 | s12 = 0.5 | s22 = 0.8 |
CONCEPTS
Natural selection is the differential reproduction of genotypes. It is measured as fitness, which is the reproductive success of a genotype compared with other genotypes in a population.
CONCEPT CHECK 9
The average numbers of offspring produced by three genotypes are: GG = 6; Gg = 3, gg = 2. What is the fitness of Gg?
- 3
- 0.5
- 0.3
- 0.27
The General Selection Model
With selection, differential fitness among genotypes leads to changes in the frequencies of the genotypes over time, which, in turn, lead to changes in the frequencies of the alleles that make up the genotypes. We can predict the effect of natural selection on allelic frequencies by using a general selection model, which is outlined in Table 25.4. Use of this model requires knowledge of both the initial allelic frequencies and the fitness values of the genotypes. It assumes that mating is random and that the only force acting on a population is natural selection. The general selection model can be used to calculate the allelic frequencies after any type of selection. It is also possible to work out formulas for determining the change in allelic frequency when selection is against recessive, dominant, and codominant traits, as well as traits in which the heterozygote has highest fitness (Table 25.5).
| A1A1 | A1A2 | A2A2 | |
|---|---|---|---|
| Initial genotypic frequencies | p2 | 2pq | q2 |
| Fitnesses | W11 | W12 | W22 |
| Proportionate contribution of genotypes to population | p2W11 | 2pqW12 | q2W22 |
| Relative genotypic frequency after selection |

|

|

|
Note:  = p2W11 + 2pqW12 + q2W22
 |
|||
Allelic frequencies after selection:  .
.
| Fitness Values | ||||
|---|---|---|---|---|
| Type of Selection | A1A1 | A1A2 | A2A2 | Change in q |
| Selection against a recessive trait | 1 | 1 | 1 − s |

|
| Selection against a dominant trait | 1 | 1 − s | 1 − s |

|
| Selection against a trait with no dominance | 1 | 1 −  s
s
|
1 − s |

|
| Selection against both homozygotes (overdominance) | 1 − s11 | 1 | 1 − s22 |
|
733
CONCEPTS
The change in allelic frequency due to selection can be determined for any type of genetic trait by using the general selection model.
WORKED PROBLEM
Let’s apply the general selection model in Table 25.4 to a real example. Alcohol is a common substance in rotting fruit, where fruit-fly larvae grow and develop; larvae use the enzyme alcohol dehydrogenase (ADH) to detoxify the effects of the alcohol. In some fruit-fly populations, two alleles are present at the locus that encodes ADH: AdhF, which encodes a form of the enzyme that migrates rapidly (fast) on an electrophoretic gel; and AdhS, which encodes a form of the enzyme that migrates slowly on an electrophoretic gel. Female fruit flies with different Adh genotypes produce the following numbers of offspring when alcohol is present:
| Genotype | Mean number of offspring |
|---|---|
| AdhF/AdhF | 120 |
| AdhF/Adhs | 60 |
| AdhS/AdhS | 30 |
- a. Calculate the relative fitnesses of females having these genotypes.
- b. If a population of fruit flies has an initial frequency of AdhF equal to 0.2, what will the frequency be in the next generation when alcohol is present?
Solution Strategy
What information is required in your answer to the problem?
- a. The fitnesses of females of each genotype.
- b. The frequency of Adh in the next generation when alcohol is present.
What information is provided to solve the problem?
- The mean numbers of offspring produced by each genotype.
- The population has an initial allelic frequency of 0.2.
Solution Steps
- a. First, we must calculate the fitnesses of the three genotypes. Fitness is the relative reproductive output of a genotype and is calculated by dividing the mean number of offspring produced by that genotype by the mean number of offspring produced by the most prolific genotype. The fitnesses of the three Adh genotypes therefore are:
Genotype Mean number of offspring Fitness AdhF/AdhF 120 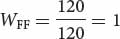
AdhF/AdhS 60 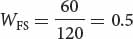
AdhS/AdhS 30 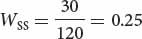
734
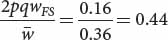
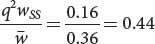
AdhFAdhF AdhFAdhS AdhSAdhS Initial genotypic frequencies: p2 = (0.2)2 = 0.04 2pq = 2(0.2)(0.8) = 0.32 q2 = (0.8)2 = 0.64 Fitnesses: WFF = 1 WFS = 0.5 WSS = 0.25 Proportionate contribution of genotypes to population: p2WFF = 0.04(1) = 0.04 2pqWFS = (0.32)(0.5) = 0.16 q2WSS = (0.64)(0.25) = 0.16 - b. To calculate the frequency of the AdhF allele after selection, we can apply the table method. In the first row of the table above, we record the initial genotypic frequencies before selection has acted. If mating has been random (an assumption of the model), the genotypes will have the Hardy–Weinberg equilibrium frequencies of p2, 2pq, and q2. In the second row of the table above, we put the fitness values of the corresponding genotypes. The proportion of the population represented by each genotype after selection is obtained by multiplying the initial genotypic frequency times its fitness (third row of Table 25.4). Now the genotypes are no longer in Hardy–Weinberg equilibrium.
The mean fitness ( ) of the population is the sum of the proportionate contributions of the three genotypes:
= p2W11 + 2pqW12 + q2W22 = 0.04 + 0.16 + 0.16 = 0.36. The mean fitness w is the average fitness of all individuals in the population and allows the frequencies of the genotypes after selection to be obtained.
) of the population is the sum of the proportionate contributions of the three genotypes:
= p2W11 + 2pqW12 + q2W22 = 0.04 + 0.16 + 0.16 = 0.36. The mean fitness w is the average fitness of all individuals in the population and allows the frequencies of the genotypes after selection to be obtained.
The frequency of a genotype after selection will be equal to its proportionate contribution divided by the mean fitness of the population (p2W11/
for genotype A1A1, 2pqW12/
for genotype A1A2, and q2W22/
for genotype A2A2) as shown in the fourth line of Table 25.4. We can now add these values to our table as shown below:After the new genotypic frequencies have been calculated, the new allelic frequency of AdhF (p′) can be determined by using the now-familiar formula of Equation 25.4:AdhFAdhF AdhFAdhS AdhSAdhS Initial genotypic frequencies: p2 = (0.2)2 = 0.04 2pq = 2(0.2)(0.8) = 0.32 q2 = (0.8)2 = 0.64 Fitnesses: WFF = 1 WFS = 0.5 WSS = 0.25 Proportionate contribution of genotypes to population: p2WFF = 0.04(1) = 0.04 2pqWFS = (0.32)(0.5) = 0.16 q2WSS = (0.64)(0.25) = 0.16 Relative genotypic frequency after selection: 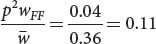
and that of q′ can be obtained by subtraction: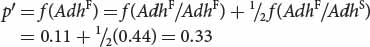
We predict that the frequency of AdhF will increase from 0.2 to 0.33.
For more practice with the selection model, try Problem 37 at the end of this chapter.
The Results of Selection
The results of selection depend on the relative fitnesses of the genotypes. If we have three genotypes (A1A1, A1A2, and A2A2) with fitnesses W11, W12, and W22, we can identify six different types of natural selection (Table 25.6). In type 1 selection, a dominant allele A1 confers a fitness advantage; in this case, the fitnesses of genotypes A1A1 and A1A2 are equal and higher than the fitness of A2A2 (W11 = W12 > W22). Because both the heterozygote and the A1A1 homozygote have copies of the A1 allele and produce more offspring than the A2A2 homozygote does, the frequency of the A1 allele will increase with time, and the frequency of the A2 allele will decrease. This form of selection, in which one allele or trait is favored over another, is termed directional selection.
| Type | Fitness Relation | Form of Selection | Result |
|---|---|---|---|
| 1 | W11 = W12 > W22 | Directional selection against recessive allele A2 | A1 increases, A2 decreases |
| 2 | W11 = W12 < W22 | Directional selection against dominant allele A1 | A2 increases, A1 decreases |
| 3 | W11 > W12 > W22 | Directional selection against incompletely dominant allele A2 | A1 increases, A2 decreases |
| 4 | W11 < W12 < W22 | Directional selection against incompletely dominant allele A1 | A2 increases, A1 decreases |
| 5 | W11 < W12 > W22 | Overdominance | Stable equilibrium, both alleles maintained |
| 6 | W11 > W12 < W22 | Underdominance | Unstable equilibrium |
| Note: W11, W12, and W22 represent the fitnesses of genotypes A1A1, A1A2, and A2A2, respectively. | |||
Type 2 selection (see Table 25.6) is directional selection against a dominant allele A1 (W11 = W12 < W22). In this case, the A2 allele increases and the A1 allele decreases. Type 3 and type 4 selection also are directional selection but, in these cases, there is incomplete dominance and the heterozygote has a fitness that is intermediate between the two homozygotes (W11 > W12 > W22 for type 3; W11 < W12 < W22 for type 4). When A1A1 has the highest fitness (type 3), the A1 allele increases and the A2 allele decreases with the passage of time. When A2A2 has the highest fitness (type 4), the A2 allele increases and the A1 allele decreases with time. Eventually, directional selection leads to fixation of the favored allele and elimination of the other allele, as long as no other evolutionary forces act on the population.
735
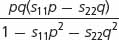
Two types of selection (types 5 and 6) are special situations that lead to equilibrium, where there is no further change in allelic frequency. Type 5 selection is referred to as overdominance or heterozygote advantage. Here, the heterozygote has higher fitness than the fitnesses of the two homozygotes (W11 < W12 > W22). With overdominance, both alleles are favored in the heterozygote, and neither allele is eliminated from the population. Initially, the allelic frequencies may change because one homozygote has higher fitness than the other; the direction of change will depend on the relative fitness values of the two homozygotes. The allelic frequencies change with overdominant selection until a stable equilibrium is reached, at which point there is no further change. The allelic frequency at equilibrium (
) depends on the relative fitnesses (usually expressed as selection coefficients) of the two homozygotes:
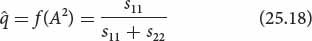
where s11 represents the selection coefficient of the A1A1 homozygote and s22 represents the selection coefficient of the A2A2 homozygote.
An example of overdominance is the gene for sickle-cell anemia in humans, a disease that results from a mutation in one of the genes that encodes hemoglobin. People who are homozygous for the sickle-cell mutation produce only sickle-cell hemoglobin, have severe anemia, and often have tissue damage. People who are heterozygous—with one normal copy and one mutated copy of the gene—produce both normal and sickle-cell hemoglobin, but their red blood cells contain enough normal hemoglobin to prevent sickle-cell anemia. However, heterozygotes are resistant to malaria and have higher fitness than do homozygotes for normal hemoglobin and homozygotes for sickle-cell anemia.
The last type of selection (type 6) is underdominance, in which the heterozygote has lower fitness than both homozygotes (W11 > W12 < W22). Underdominance leads to an unstable equilibrium; here, allelic frequencies will not change as long as they are at equilibrium but, if they are disturbed from the equilibrium point by some other evolutionary force, they will move away from equilibrium until one allele eventually becomes fixed. To see the effects of natural selection on allelic and genotypic frequencies, view the Mini-Tutorial in  Animation 25.1.
 ![]() TRY PROBLEM 10
TRY PROBLEM 10
CONCEPTS
Natural selection changes allelic frequencies; the direction and magnitude of change depend on the intensity of selection, the dominance relations of the alleles, and the allelic frequencies. Directional selection favors one allele over another and eventually leads to fixation of the favored allele. Overdominance leads to a stable equilibrium with maintenance of both alleles in the population. Underdominance produces an unstable equilibrium because the heterozygote has lower fitness than those of the two homozygotes.
CONCEPT CHECK 10
How does overdominance differ from directional selection?
Change in the Allelic Frequency of a Recessive Allele Due to Natural Selection
The rate at which selection changes allelic frequencies depends on the allelic frequency itself. If an allele (A2) is lethal and recessive, W11 = W12 = 1, whereas W22 = 0. The frequency of the A2 allele will decrease with time (because the A2A2 homozygote produces no offspring), and the rate of decrease will be proportional to the frequency of the recessive allele. When the frequency of the allele is high, the change in each generation is relatively large but, as the frequency of the allele drops, a higher proportion of the alleles are in the heterozygous genotypes, where they are immune to the action of natural selection (the heterozygotes have the same phenotype as the favored homozygote). Thus, selection against a rare recessive allele is very inefficient and its removal from the population is slow.
The relation between the frequency of a recessive allele and its rate of change under natural selection has an important implication. Some people believe that the medical treatment of patients with rare recessive diseases will cause the disease gene to increase, eventually leading to degeneration of the human gene pool. This mistaken belief was the basis of eugenic laws that were passed in the early part of the twentieth century prohibiting the marriage of persons with certain genetic conditions and allowing the involuntary sterilization of others. However, most copies of rare recessive alleles are present in heterozygotes, and selection against the homozygotes will have little effect on the frequency of a recessive allele. Thus, whether the homozygotes for a recessive trait reproduce or not has little effect on the frequency of the disorder.
736
Mutation and Natural Selection
Recurrent mutation and natural selection act as opposing forces on detrimental alleles; mutation increases their frequency and natural selection decreases their frequency. Eventually, these two forces reach an equilibrium, in which the number of alleles added by mutation is balanced by the number of alleles removed by selection.
The frequency of a deleterious recessive allele at equilibrium (
) is equal to the square root of the mutation rate divided by the selection coefficient:
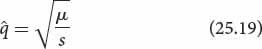
For selection acting on a deleterious dominant allele, the frequency of the dominant allele at equilibrium can be shown to be
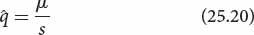
Achondroplasia is a common type of human dwarfism that results from a dominant gene. People with this condition are fertile, although they produce only about 74% as many children as are produced by people without achondroplasia. The fitness of people with achondroplasia therefore averages 0.74, and the selection coefficient (s) is 1 − W, or 0.26. If we assume that the mutation rate for achondroplasia is about 3 × 10⁻⁵ (a typical mutation rate in humans), then we can predict that the equilibrium frequency for the achondroplasia allele will be
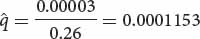
This frequency is close to the actual frequency of the condition. ![]() TRY PROBLEM 41
TRY PROBLEM 41
CONCEPTS
Mutation and natural selection act as opposing forces on detrimental alleles: mutation tends to increase their frequency and natural selection tends to decrease their frequency, eventually producing an equilibrium.
CONNECTING CONCEPTS: The General Effects of Forces That Change Allelic Frequencies
You now know that four processes bring about change in the allelic frequencies of a population: mutation, migration, genetic drift, and natural selection. Their short- and long-term effects on allelic frequencies are summarized in Table 25.7. In some cases, these changes continue until one allele is eliminated and the other becomes fixed in the population. Genetic drift and directional selection will eventually result in fixation, provided these forces are the only ones acting on a population. With the other evolutionary forces, allelic frequencies change until an equilibrium point is reached, and then there is no additional change in allelic frequency. Mutation, migration, and some forms of natural selection can lead to stable equilibria (see Table 25.7).
| Force | Short-Term Effect | Long-Term Effect |
|---|---|---|
| Mutation | Change in allelic frequency | Equilibrium reached between forward and reverse mutations |
| Migration | Change in allelic frequency | Equilibrium reached when allelic frequencies of source and recipient population are equal |
| Genetic drift | Change in allelic frequency | Fixation of one allele |
| Natural selection | Change in allelic frequency | Directional selection: fixation of one allele Overdominant selection: equilibrium reached |
The different evolutionary forces affect both genetic variation within populations and genetic divergence between populations. Evolutionary forces that maintain or increase genetic variation within populations are listed in the upper-left quadrant of Figure 25.15. These forces include some types of natural selection, such as overdominance, in which both alleles are favored. Mutation and migration also increase genetic variation within populations because they introduce new alleles to the population. Evolutionary forces that decrease genetic variation within populations are listed in the lower-left quadrant of Figure 25.15. These forces include genetic drift, which decreases variation through the fixation of alleles, and some forms of natural selection such as directional selection.
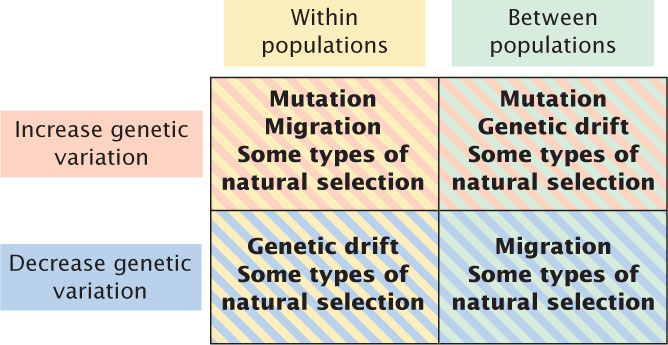
The various evolutionary forces also affect the amount of genetic divergence between populations. Natural selection increases divergence between populations if different alleles are favored in the different populations, but it can also decrease divergence between populations by favoring the same allele in the different populations. Mutation almost always increases divergence between populations because different mutations arise in each population. Genetic drift also increases divergence between populations because changes in allelic frequencies due to drift are random and are likely to change in different directions in separate populations. Migration, on the other hand, decreases divergence between populations because it makes populations similar in their genetic composition.
Migration and genetic drift act in opposite directions: migration increases genetic variation within populations and decreases divergence between populations, whereas genetic drift decreases genetic variation within populations and increases divergence among populations. Mutation increases both variation within populations and divergence between populations. Natural selection can either increase or decrease variation within populations, and it can increase or decrease divergence between populations.
737
An important point to keep in mind is that real populations are simultaneously affected by many evolutionary forces. We have examined the effects of mutation, migration, genetic drift, and natural selection in isolation so that the influence of each process would be clear. However, in the real world, populations are commonly affected by several evolutionary forces at the same time, and evolution results from the complex interplay of numerous processes.