26.2 Many Natural Populations Contain High Levels of Genetic Variation
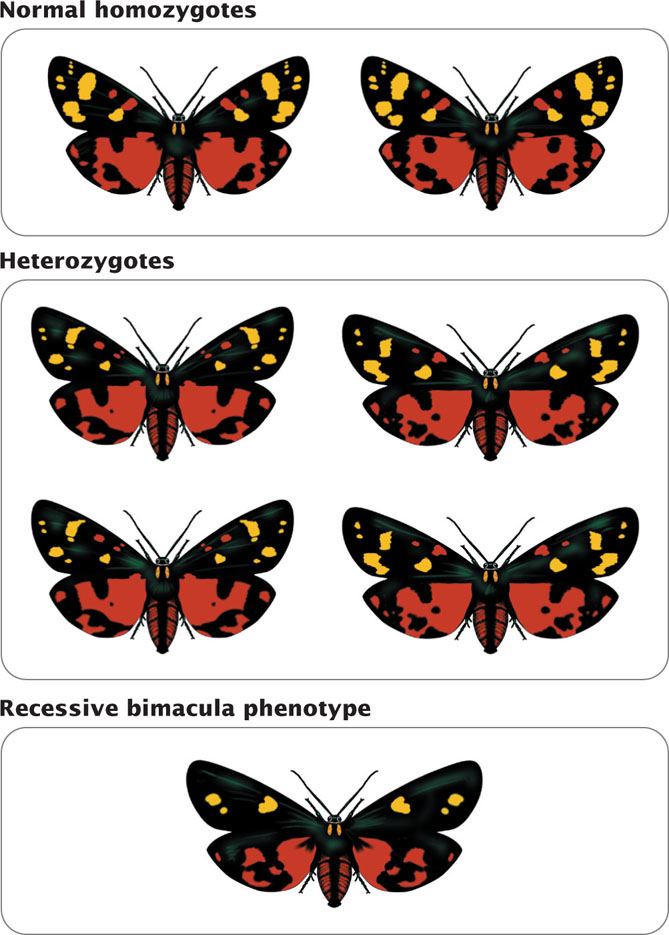
Because genetic variation must be present for evolution to take place, evolutionary biologists have long been interested in the amounts of genetic variation in natural populations and the forces that control the amount and nature of that variation. For many years, they could not examine genes directly and were limited to studying the phenotypes of organisms. Although genetic variation could not be quantified directly, studies of phenotypes suggested that many populations of organisms harbor considerable genetic variation. Populations of organisms in nature exhibit tremendous phenotypic variation: frogs vary in color patterns, birds differ in size, butterflies vary in spotting patterns, mice differ in coat color, and humans vary in blood types, to mention just a few. Crosses revealed that a few of these traits were inherited as simple genetic traits (Figure 26.2) but, for most traits, the precise genetic basis was complex and unknown, preventing early evolutionary geneticists from quantifying the amount of genetic variation in natural populations.
As discussed in Chapter 24, a population’s response to selection depends on narrow-sense heritability, which is a measure of the additive genetic variation of a trait within a population. Many organisms respond to artificial selection carried out by humans, suggesting that the populations of these organisms contain much additive genetic variation. For example, humans have used artificial selection to produce numerous dog breeds, which vary tremendously in size, shape, color, and behavior (see Figure 24.21). Early studies of chromosome variations in Drosophila and plants also suggested that genetic variation in natural populations is plentiful and widespread.
Molecular Variation
Advances in molecular genetics have made it possible to investigate evolutionary change directly by analyzing protein and nucleic acid sequences. These molecular data offer a number of advantages for studying the process and pattern of evolution:
Molecular data are genetic. Evolution results from genetic change with time. Many anatomical, behavioral, and physiological traits have a genetic basis, but the relation between the underlying genes and the trait may be complex. Protein- and nucleic-acid-sequence variation has a clear genetic basis that is often easy to interpret. Molecular methods can be used with all organisms. Early studies of population genetics relied on simple genetic traits such as human blood types, banding patterns in snails, or spotting patterns in butterflies (see Figure 26.2), which are restricted to a small group of organisms. However, all living organisms have proteins and nucleic acids, so molecular data can be collected from any organism.
746
Molecular methods can be applied to a huge amount of genetic variation. An enormous amount of data can be accessed by molecular methods. The human genome, for example, contains more than 3 billion base pairs of DNA, which constitutes a large pool of information about our evolution.
All organisms can be compared with the use of molecular data. Trying to assess the evolutionary history of distantly related organisms is often difficult because they have few characteristics in common. The evolutionary relationships between angiosperms were traditionally assessed by comparing floral anatomy, whereas the evolutionary relationships of bacteria were determined by their nutritional and staining properties. Because plants and bacteria have so few structural characteristics in common, evaluating how they are related to one another was difficult in the past. All organisms have certain molecular traits in common, such as ribosomal RNA sequences and some fundamental proteins. These molecules offer a valid basis for comparisons among all organisms. Molecular data are quantifiable. Protein and nucleic acid sequence data are precise, accurate, and quantifiable, which facilitates the objective assessment of evolutionary relationships.
Molecular data often provide information about the process of evolution. Molecular data can reveal important clues about the process of evolution. For example, the results of a study of DNA sequences have revealed that one type of insecticide resistance in mosquitoes probably arose from a single mutation that subsequently spread throughout the world. The database of molecular information is large and growing. Today, this database of DNA and protein sequences can be used for making evolutionary comparisons and inferring mechanisms of evolution.
CONCEPTS
Molecular techniques and data offer a number of advantages for evolutionary studies. Molecular data are genetic in nature and can be investigated in all organisms; they provide potentially large data sets, allow all organisms to be compared by using the same characteristics, are easily quantifiable, and provide information about the process of evolution.
Protein Variation
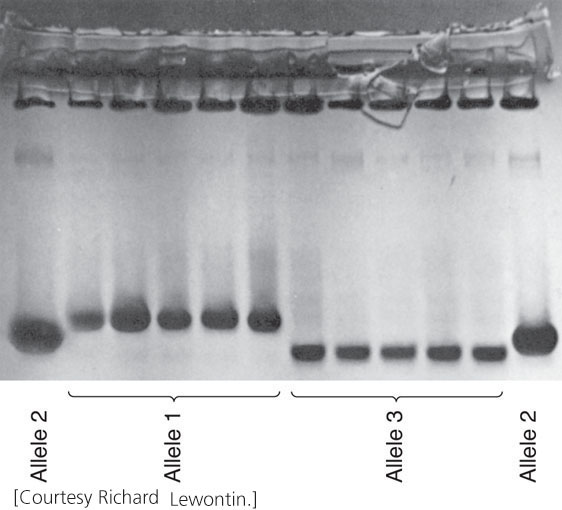
The initial breakthrough in quantifying genetic variation in natural populations came with the application of electrophoresis (see Figure 19.3) to population studies. This technique separates macromolecules, such as proteins or nucleic acids, on the basis of their size and charge. In 1966, Richard Lewontin and John Hubby extracted proteins from fruit flies, separated the proteins by electrophoresis, and stained them for specific enzymes. An examination of the pattern of bands on gels enabled them to assign genotypes to individual flies and to quantify the amount of genetic variation in natural populations. In the same year, Harry Harris quantified genetic variation in human populations by using the same technique.
Numerous studies have now examined protein variation in a wide variety of organisms and found that most populations possess a large amount of variation in proteins (Figure 26.3). However, protein electrophoresis actually underestimates the true amount of genetic variation because it does not detect some amino acid substitutions; nor does it detect genetic variation in DNA that does not alter the amino acids of a protein (synonymous codons and variation in noncoding regions of the DNA).
One hypothesis to account for the extensive molecular variation in proteins is the neutral-mutation hypothesis, which proposes that much molecular variation is adaptively neutral; individuals with different molecular variants have equal fitness. This hypothesis, developed by Motoo Kimura, does not propose that the proteins are functionless; rather, it suggests that most variants are functionally equivalent. Because these variants are functionally equivalent, natural selection does not differentiate between them, and their evolution is shaped largely by the random processes of genetic drift and mutation. The neutral-mutation hypothesis accepts that natural selection is an important force in evolution but views selection as a process that favors the “best” allele while eliminating others. It proposes that, when selection is important, there will be little genetic variation.
747
Another view, termed the balance hypothesis, is that the genetic variation in natural populations is maintained by selection that favors variation (balancing selection). Overdominance, in which the heterozygote has higher fitness than that of either homozygote, is one type of balancing selection. Under this hypothesis, the molecular variants are not physiologically equivalent and do not have the same fitness. Instead, genetic variation within natural populations is shaped largely by selection, and, when selection is important, there will be much variation.
Many attempts to disprove one hypothesis or the other failed, because it was unclear precisely how much variation was actually present (remember that protein electrophoresis detects only some genetic variation) and because both hypotheses are capable of explaining many different patterns of genetic variation. The results of recent studies that provide direct information about DNA sequence variation demonstrate that much variation at the level of DNA has little obvious effect on the phenotype and is therefore likely to be neutral.
CONCEPTS
The application of electrophoresis to the study of protein variation in natural populations revealed that most organisms possess large amounts of genetic variation. The neutral-mutation hypothesis proposes that most molecular variation is neutral with regard to natural selection and is shaped largely by mutation and genetic drift. The balance hypothesis proposes that genetic variation is maintained by balancing selection.
 CONCEPT CHECK 2
Which statement is true of the neutral-mutation hypothesis?
- All proteins are functionless.
- Natural selection plays no role in evolution.
- Most molecular variants are functionally equivalent.
- All of the above.
DNA Sequence Variation
The development of techniques for isolating, cutting, and sequencing DNA in the past 30 years has provided powerful tools for detecting, quantifying, and investigating genetic variation. The application of these techniques has provided a detailed view of genetic variation at the molecular level.
Restriction-Site Variation
Among the first techniques for detecting and analyzing genetic variation in DNA sequences was the use of restriction enzymes. Each restriction enzyme recognizes and cuts a particular sequence of DNA nucleotides known as that enzyme’s restriction site (see Chapter 19). Variation in the presence of a restriction site is called a restriction fragment length polymorphism (RFLP; see Figure 19.22). Each restriction enzyme recognizes a limited number of nucleotide sites in a particular piece of DNA but, if a number of different restriction enzymes are used and the sites recognized by the enzymes are assumed to be random sequences, RFLPs can be used to estimate the amount of variation in the DNA and the proportion of nucleotides that differ between organisms. RFLPs can also be used to analyze the genetic structure of populations and to assess evolutionary relationships among organisms. RFLPs were widely used in evolutionary studies before the development of rapid and inexpensive methods for directly sequencing DNA, and restriction analysis is still employed today in some studies of molecular evolution.
Microsatellite Variation
Microsatellites are short DNA sequences that exist in multiple copies repeated in tandem. Variation in the number of copies of the repeats is common, with individual organisms often differing in the number of repeat copies. Microsatellites can be detected by using the polymerase chain reaction (PCR). Pairs of primers are used that flank a region of repeated copies of the sequence. The DNA fragments that are synthesized in the PCR reaction vary in length, depending on the number of tandem repeats present. DNA from an individual organism with more repeats will produce a longer amplified segment. After PCR has been completed, the amplified fragments are separated with the use of gel electrophoresis and stained, producing a series of bands on a gel (see Figure 19.28). The banding patterns that result represent different alleles and can be used to quantify genetic variation, assess genetic relationships among individual organisms, and quantify genetic differences in a population. An advantage of using microsatellites is that the PCR reaction can be used on very small amounts of DNA and is rapid. The amplified fragments can be fluorescently labeled and detected by a laser, allowing the process to be automated.
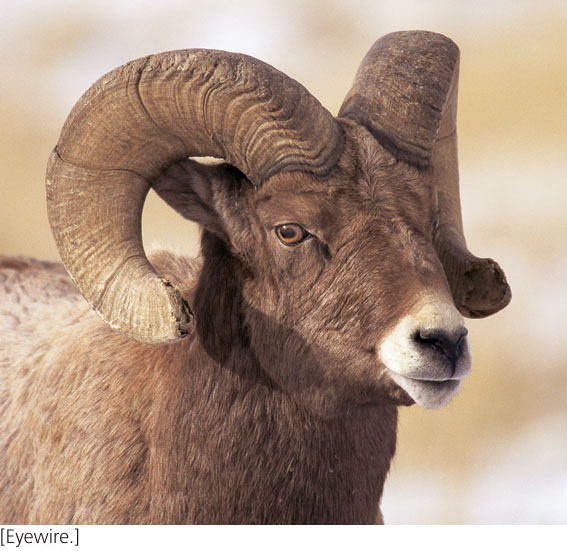
David Coltman and his colleagues used microsatellite variation to study paternity in bighorn sheep (Figure 26.4; also see the introduction to Chapter 25) and showed that sport hunting of trophy rams has reduced the weight and horn size of the animals. Samples of blood, hair, and ear tissue were collected from bighorn sheep at Ram Mountain in Alberta, Canada—a population that has been monitored since 1971. DNA was extracted from the tissue samples and amplified with PCR, revealing variation at 20 microsatellite loci. On the basis of the microsatellite variation, paternity was assigned to 241 rams, and the family relationships of the sheep were worked out. Using these family relationships and the quantitative genetic techniques described in Chapter 24, the geneticists were able to show that ram weight and horn size had high heritability and exhibited a strong positive genetic correlation. Trophy hunters selectively shoot rams with large horns, often before they are able to reproduce. This selective pressure has produced a response to selection: the rams are evolving smaller horns. Between 1971 and 2002, horn size in the population decreased by about one quarter. Because of the positive genetic correlation between horn size and body size, the body size of rams also is decreasing. The killing of trophy rams with large horns has led to a decrease in the very traits that are prized by the hunters. This research illustrates a practical application of the use of microsatellites in evolutionary analysis.
748
Variation Detected by DNA Sequencing
Techniques for rapidly and inexpensively sequencing DNA (see Chapter 19) have made this type of data an important tool in population and evolutionary studies. DNA sequence data often reveal processes that influence evolution and are invaluable for determining the evolutionary relationships of different organisms. The use of PCR for producing the DNA used in the sequencing reactions means that data can be obtained from a very small initial sample of DNA.
DNA sequencing was used to reassess the genetic relationships among African elephants. Alfred Roca and his colleagues obtained tissue samples from 195 elephants by shooting them with needlelike darts that fell to the ground after hitting an elephant but retained a small plug of skin. From the skin samples, the scientists sequenced 1732 base pairs of DNA from four nuclear genes. Their analysis revealed large genetic differences between forest elephants and savannah elephants, suggesting that there is limited gene flow (migration) between these two groups of elephants. On the basis of these results, the scientists proposed that two different species of elephants exist in Africa.
Another example of the use of DNA sequence data to decipher evolutionary relationships was the unusual case of HIV infection in a dental practice in Florida. In July 1990, the U.S. Centers for Disease Control and Prevention (CDC) reported that a young woman in Florida had become HIV positive after undergoing an invasive dental procedure performed by a dentist who had AIDS. The woman had no known risk factors for HIV infection and no known contact with other HIV-positive persons. The CDC acknowledged that she might have acquired the infection from her dentist. By 1992, seven of the dentist’s patients had tested positive for HIV, and this number eventually increased to ten.
All of the dentist’s HIV-positive patients had received invasive dental procedures, such as root canals and tooth extractions, in the period when the dentist was infected. Among the seven patients originally studied by the CDC (patients A–G, Table 26.1), two had known risk factors for HIV infection (intravenous drug use, homosexual behavior, or sexual relations with HIV-infected persons), and a third had possible but unconfirmed risk factors.
| Average Differences in DNA Sequences (%) | ||||
|---|---|---|---|---|
| Person | Sex | Known Risk Factors | From HIV from Dentist | From HIV from Controls |
| Dentist | M | Yes | 11.0 | |
| Patient A | F | No | 3.4 | 10.9 |
| Patient B | F | No | 4.4 | 11.2 |
| Patient C | M | No | 3.4 | 11.1 |
| Patient E | F | No | 3.4 | 10.8 |
| Patient G | M | No | 4.9 | 11.8 |
| Patient D | M | Yes | 13.6 | 13.1 |
| Patient F | M | Yes | 10.7 | 11.9 |
| Source: After C. Y. Ou et al., Science 256:1165–1171, 1992, Table 1. | ||||
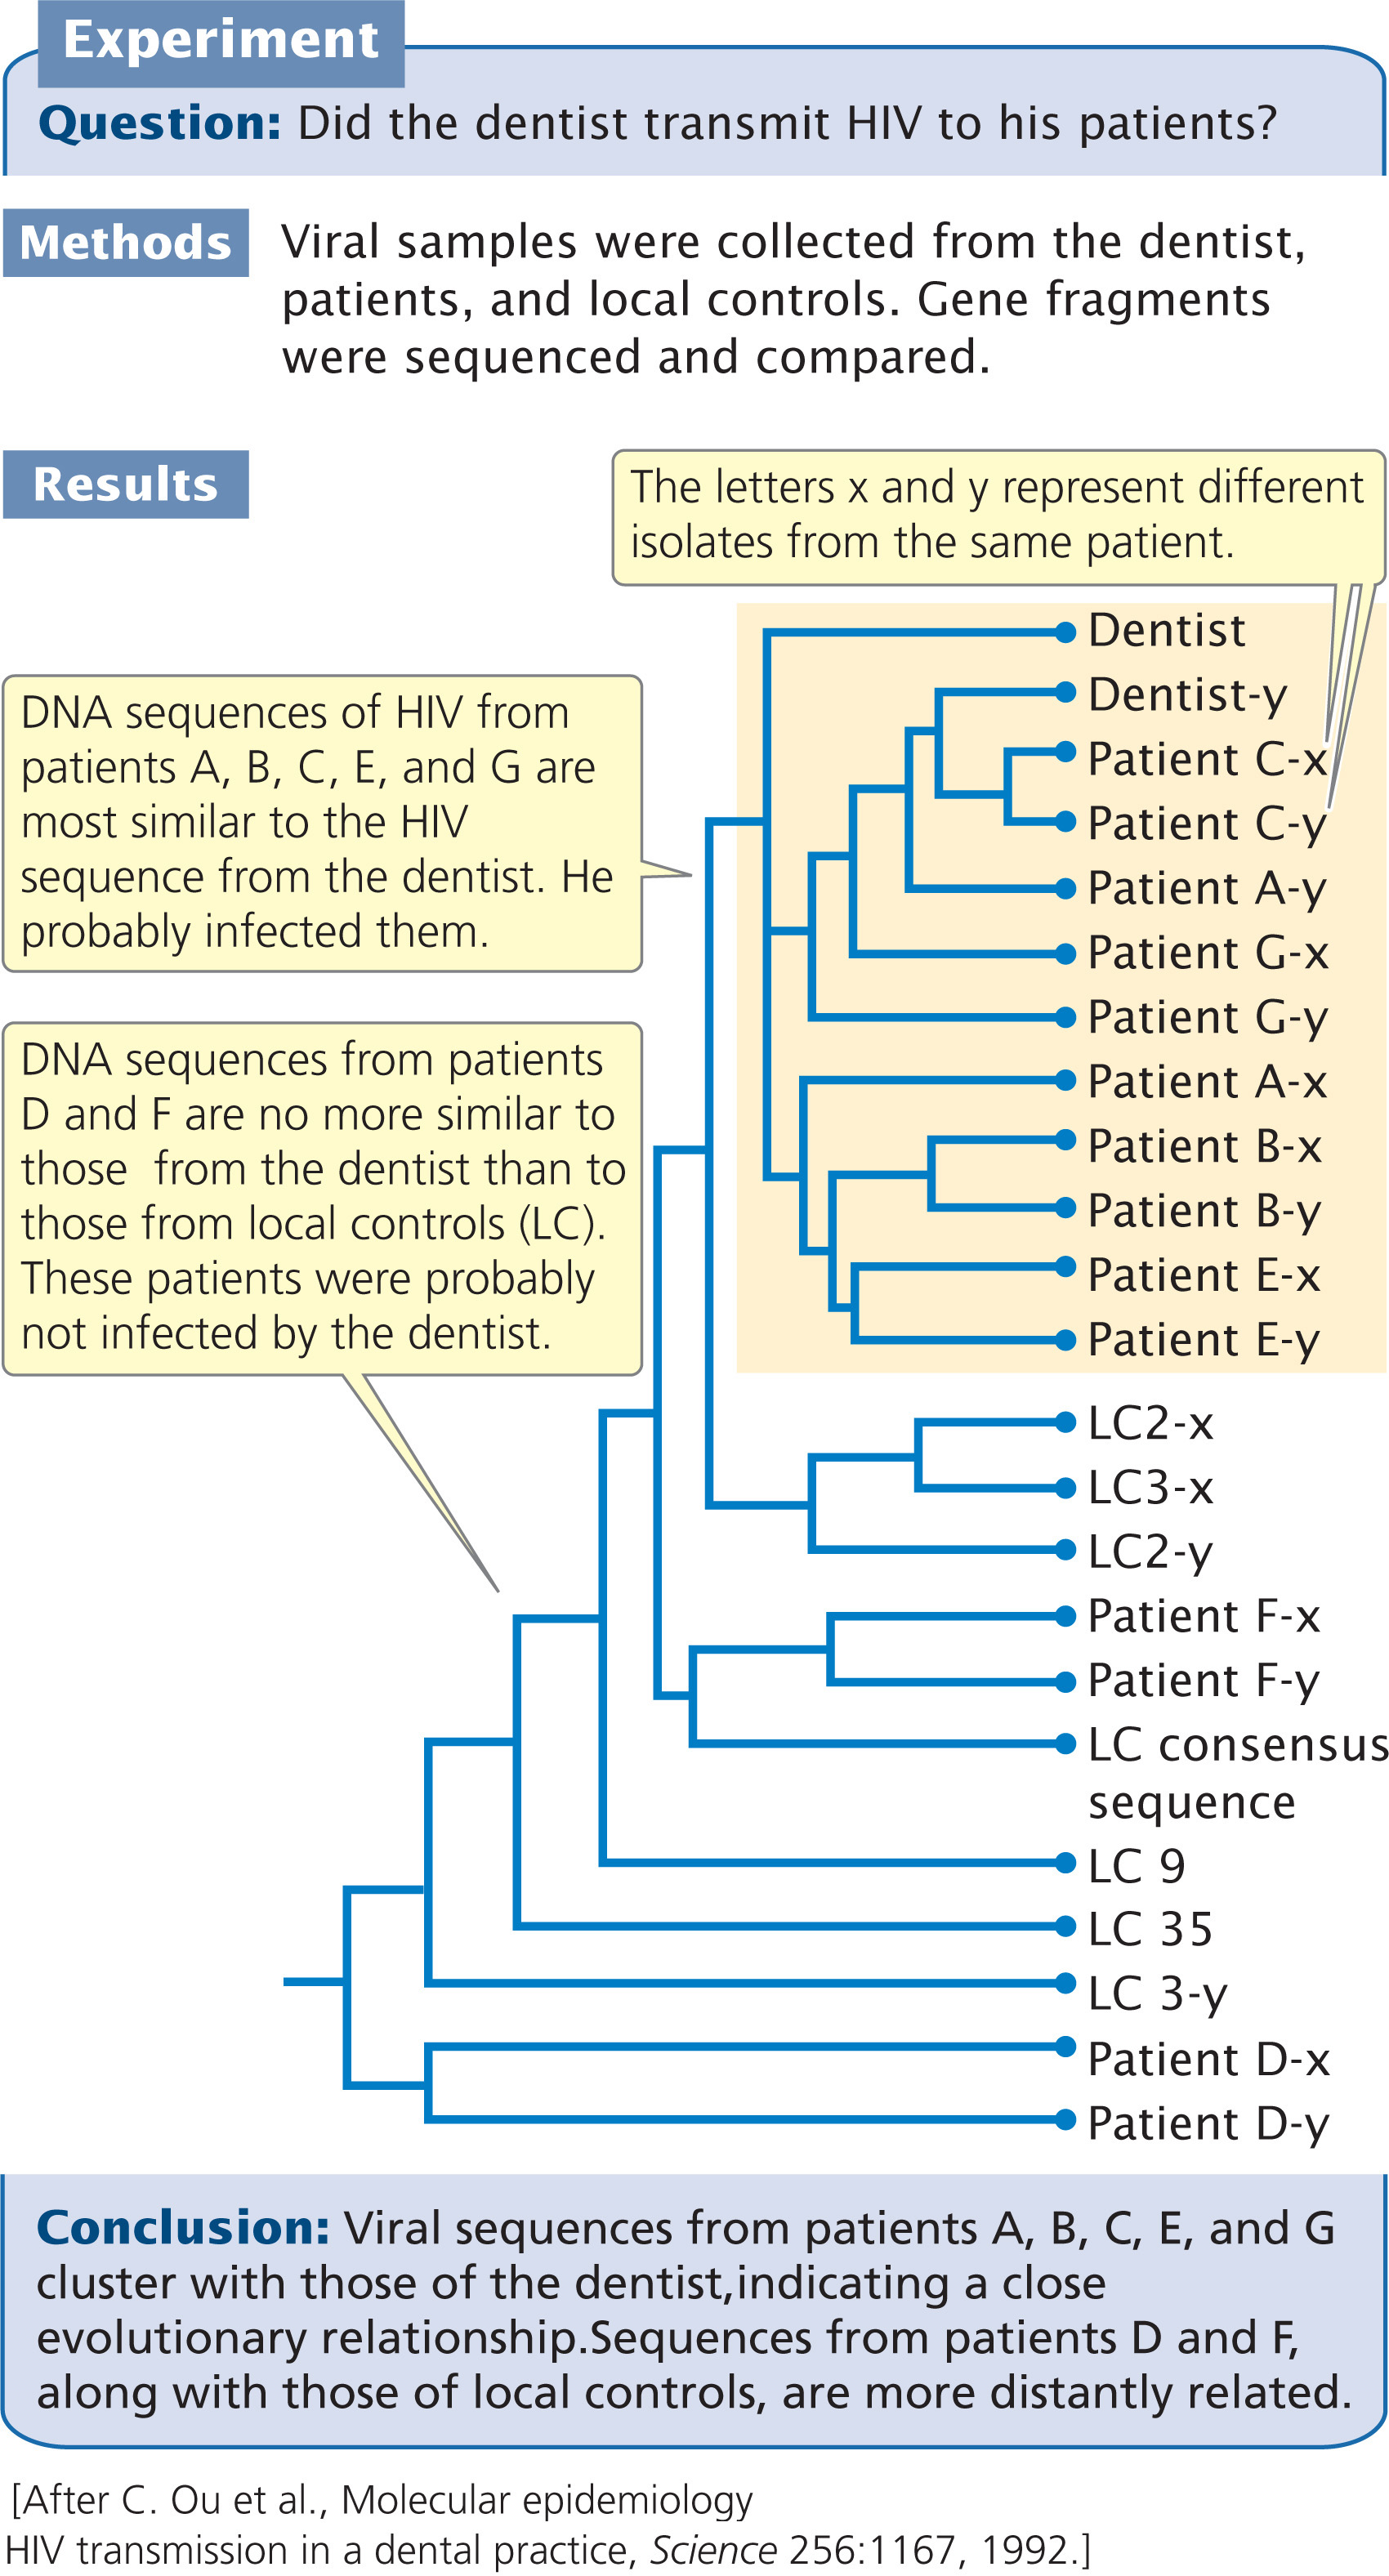
To determine whether the dentist had infected his patients, the CDC conducted a study of the molecular evolution of HIV isolates from the dentist and from the patients. HIV undergoes rapid evolution, making it possible to trace the path of its transmission.
Blood specimens were collected from the dentist, the patients, and a group of 35 local controls (other HIV-infected people who lived within 90 miles of the dental practice but who had no known contact with the dentist). DNA was extracted from white blood cells, and a 680-bp fragment of the envelope gene of the virus was amplified by PCR. The fragments from the dentist, patients, and local controls were then sequenced and compared.
The divergence between the viral sequences taken from the dentist, the seven patients, and the controls is shown in Table 26.1. Viral DNA taken from patients with no confirmed risk factors (patients A, B, C, E, and G) differed from the dentist’s viral DNA by 3.4% to 4.9%, whereas the viral DNA from the controls differed from the dentist’s by an average of 11%. The viral sequences collected from five patients (A, B, C, E, and G) were more closely related to the viral sequences collected from the dentist than to viral sequences from the general population, strongly suggesting that these patients acquired their HIV infection from the dentist. The viral isolates from patients D and F (patients with confirmed risk factors), however, differed from that of the dentist by 10.7% and 13.6%, suggesting that these two patients did not acquire their infection from the dentist.
749
An analysis of the evolutionary relationships of the viral sequences confirmed that the virus taken from the dentist had a close evolutionary relationship to viruses taken from patients A, B, C, E, and G (Figure 26.5). The viruses from patients D and F, with known risk factors, were no more similar to the virus from the dentist than to viruses from local controls. Of three additional HIV-positive patients that have been identified since 1992, only one has viral sequences that are closely related to those from the dentist.
This study provides an excellent example of the relevance of evolutionary studies to real-world problems. How the dentist infected his patients during their visits to his office remains a mystery, but this case is unusual. A study of almost 16,000 patients treated by HIV-positive health-care workers failed to find a single case of confirmed transmission of HIV from the health-care worker to the patient.
CONCEPTS
Variation in DNA nucleotide sequence can be analyzed by using restriction fragment length polymorphisms, microsatellites, and data from direct DNA sequencing.
CONCEPT CHECK 3
What are some of the advantages of using microsatellites for evolutionary studies?