26.4 The Evolutionary History of a Group of Organisms Can Be Reconstructed by Studying Changes in Homologous Characteristics
The evolutionary relationships among a group of organisms are termed a phylogeny. Because most evolution takes place over long periods of time and is not amenable to direct observation, biologists must reconstruct phylogenies by inferring the evolutionary relationships among present-day organisms. The discovery of fossils of ancestral organisms can aid in the reconstruction of phylogenies, but the fossil record is often too poor to be of much help. Thus, biologists are often restricted to analyses of characteristics in present-day organisms to determine their evolutionary relationships. In the past, phylogenetic relationships were reconstructed on the basis of phenotypic characteristics—often, anatomical traits. Today, molecular data, including protein and DNA sequences, are frequently used to construct phylogenetic trees.
Phylogenies are reconstructed by inferring changes that have taken place in homologous characteristics. Such characteristics evolved from the same character in a common ancestor. For example, although the front leg of a mouse and the wing of a bat look different and have different functions, close examination of their structure and development reveals that they are indeed homologous; both evolved from the forelimb of an early mammal that was an ancestor to both mouse and bat. And, because mouse and bat have these homologous features and others in common, we know that they are both mammals. Similarly, DNA sequences are homologous if two present-day sequences evolved from a single sequence found in an ancestor. For example, all eukaryotic organisms have a gene for cytochrome c, an enzyme that helps carry out oxidative respiration. This gene is assumed to have arisen in a single organism in the distant past and was then passed down to descendants of that early ancestor. Today, all copies of the cytochrome c gene are homologous, because they all evolved from the same original copy in the distant ancestor of all organisms that possess this gene.
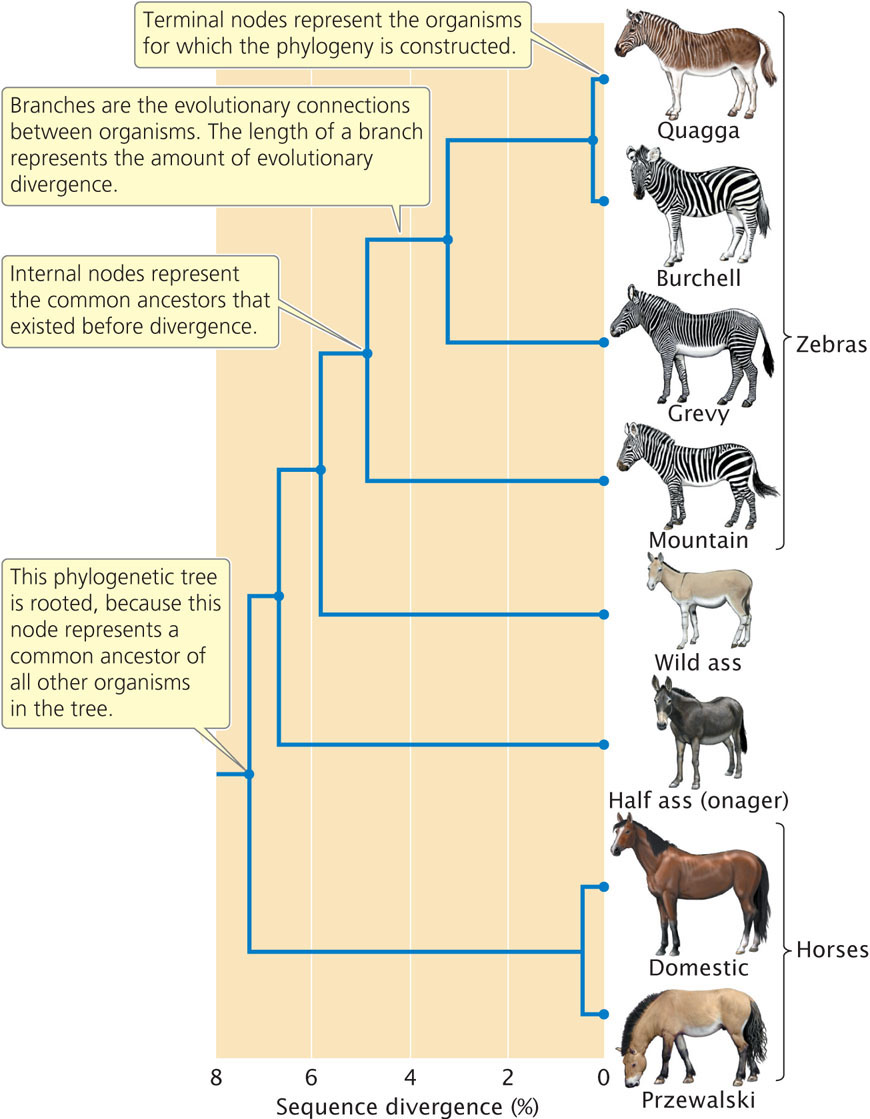
A graphical representation of a phylogeny is called a phylogenetic tree. As shown in Figure 26.12, a phylogenetic tree depicts the evolutionary relationships among different organisms, similarly to the way in which a pedigree represents the genealogical relationships among family members. A phylogenetic tree consists of nodes that represent the different organisms being compared, which might be different individuals, populations, or species. Terminal nodes (those at the end of the outermost branches of the tree) represent organisms for which data have been obtained, usually present-day organisms. Internal nodes represent common ancestors that existed before divergence between organisms took place. In most cases, the internal nodes represent past ancestors that are inferred from the analysis. The nodes are connected by branches, which represent the evolutionary connections between organisms. In some phylogenetic trees, the lengths of the branches represent the amount of evolutionary divergence that has taken place between organisms. When one internal node represents a common ancestor to all other nodes on the tree, the tree is said to be rooted. Trees are often rooted by including in the analysis an organism that is distantly related to all the others; this distantly related organism is referred to as an outgroup.
757
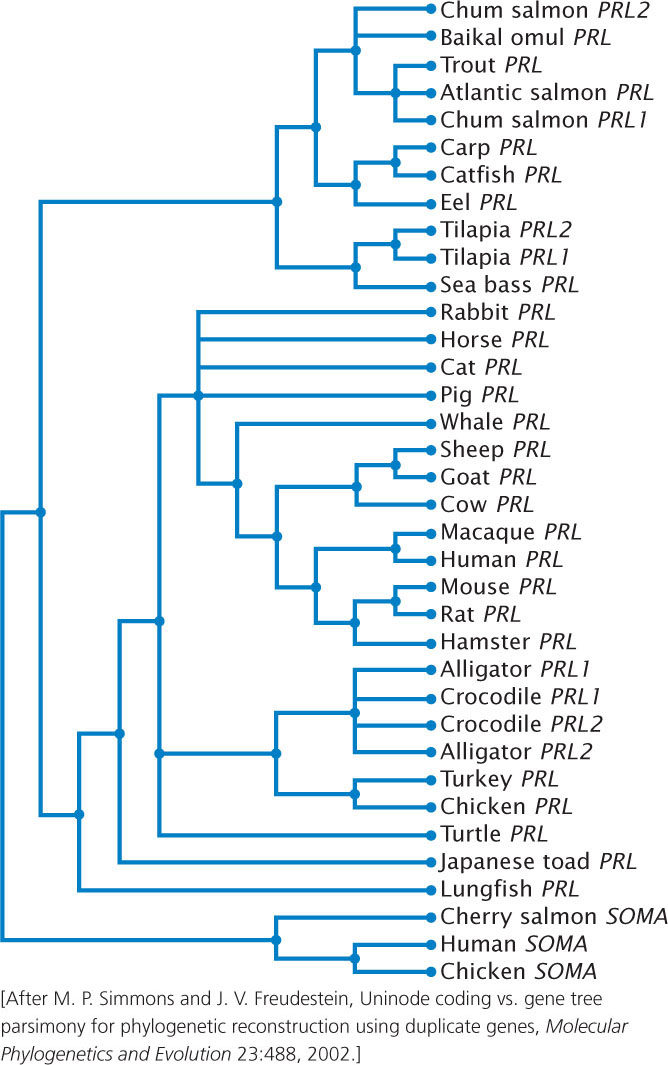
Phylogenetic trees are created to depict the evolutionary relationships among organisms; they are also created to depict the evolutionary relationships among DNA sequences. The latter type of phylogenetic tree is termed a gene tree (Figure 26.13). ![]() TRY PROBLEM 27
TRY PROBLEM 27
CONCEPTS
A phylogeny represents the evolutionary relationships among a group of organisms and is often depicted graphically by a phylogenetic tree, which consists of nodes representing the organisms and branches representing their evolutionary connections.
 CONCEPT CHECK 6
Which feature is found in a rooted tree but not in an unrooted tree?
- Terminal nodes.
- Internal nodes.
- A common ancestor to all other nodes.
- Branch lengths that represent the amount of evolutionary divergence between nodes.
The Alignment of Homologous Sequences
Today, phylogenetic trees are often constructed from DNA sequence data. This construction requires that homologous sequences be compared. Thus, a first step in constructing phylogenetic trees from DNA sequence data is to identify homologous genes and properly align their nucleotide bases. Consider the following sequences that might be found in two different organisms:
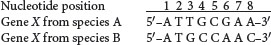
These two sequences can be aligned in several possible ways. We might assume that there have been base substitutions at positions 3, 4, 6, and 8:
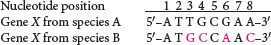
Alternatively, we might assume that a nucleotide at position 3 has been inserted or deleted, generating a gap in the sequence of species B, and that there has been a single nucleotide substitution at position 6:
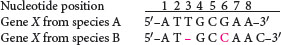
The second alignment requires fewer evolutionary steps (a deletion or insertion plus one base substitution) than does the first alignment (four base substitutions). Sequence alignments are usually made by computer programs that include assumptions about which types of change are more likely to take place. If two sequences have undergone much divergence, then generating alignments can be difficult.
758
The Construction of Phylogenetic Trees
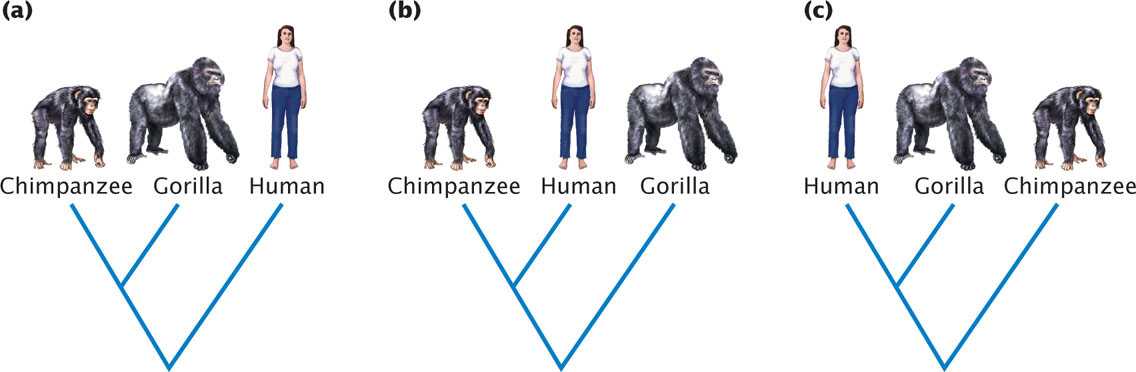
Consider a simple phylogeny that depicts the evolutionary relationships among three organisms—humans, chimpanzees, and gorillas. Charles Darwin originally proposed that chimpanzees and gorillas were closely related to humans and modern research supports a close relationship between these three species. There are three possible phylogenetic trees for humans, chimpanzees, and gorillas (Figure 26.14). The goal of the evolutionary biologist is to determine which of the trees is correct. Molecular data applied to this question strongly suggest a close relationship between humans and chimpanzees. To understand the difficulty in constructing phylogenetic trees, let’s consider for a moment the number of all possible trees that might exist for a group of organisms. The number of possible rooted trees for a group of organisms is
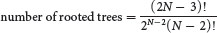
where N equals the number of organisms included in the phylogeny, and the ! symbol stands for factorial, the product of all the integers from N to 1. Substituting values of N into this equation, we find:
| Number of organisms included in phylogeny (N) | Number of rooted trees |
|---|---|
| 2 | 1 |
| 3 | 3 |
| 4 | 15 |
| 5 | 105 |
| 10 | 34,459,425 |
| 20 | 8.2 × 10²¹ |
As the number of organisms in the phylogeny increases beyond just a few, the number of possible rooted trees becomes astronomically large. Clearly, choosing the best tree by directly comparing all the possibilities is impossible.
There are several different approaches to inferring evolutionary relationships and constructing phylogenetic trees.
In one approach, termed the distance approach, evolutionary relationships are inferred on the basis of the overall degree of similarity between organisms. Typically, a number of different phenotypic characteristics or gene sequences are examined and the organisms are grouped on the basis of their overall similarity, taking into consideration all the examined characteristics and sequences. A second approach, called the maximum parsimony approach, infers phylogenetic relationships on the basis of the fewest number of evolutionary changes that must have taken place since the organisms last had an ancestor in common. A third approach, called maximum likelihood and Bayesian methods, infers phylogenetic relationships on the basis of which phylogeny maximizes the probability of obtaining the set of characteristics exhibited by the organisms. In this approach, a phylogeny with a higher probability of producing the observed characters in the organisms studied is preferred over a phylogeny with a lower probability.
With all three approaches to constructing phylogenies, several different numerical methods are available for the construction of phylogenetic trees. All include certain assumptions that help limit the number of different trees that must be considered; most rely on computer programs that compare phenotypic characteristics or sequence data to sequentially group organisms in the construction of the tree.
CONCEPTS
Molecular data can be used to infer phylogenies (evolutionary histories) of groups of living organisms. The construction of phylogenies requires the proper alignment of homologous DNA sequences. Several different approaches are used to reconstruct phylogenies, including distance methods, maximum parsimony methods, and maximum likelihood and Bayesian methods.