Application Questions and Problems
Introduction
Question 9.17
Suppose you want to compare the species of bacteria that exist in a polluted stream with the species that exist in an unpolluted stream. Traditionally, bacteria have been identified by growing them in the laboratory and comparing their physical and biochemical properties. You recognize that you will be unable to culture most of the bacteria that reside in the streams. How might you go about identifying the species in the two streams without culturing them in the laboratory?
Section 9.2
Question 9.18
John Smith is a pig farmer. For the past 5 years, Smith has been adding vitamins and low doses of antibiotics to his pig food; he says that these supplements enhance the growth of the pigs. Within the past year, however, several of his pigs died from infections of common bacteria, which failed to respond to large doses of antibiotics. Can you explain the increased rate of mortality due to infection in Smith’s pigs? What advice might you offer Smith to prevent this problem in the future?
Question 9.19
Rarely, the conjugation of Hfr and F− cells produces two Hfr cells. Explain how this event takes place.
Question 9.20
In Figure 9.8, what do the red and blue parts of the DNA labeled by balloon 6 represent?
Question 9.21
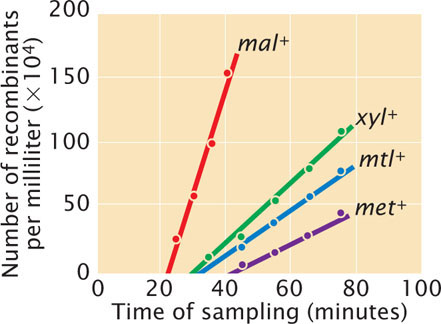
 Austin Taylor and Edward Adelberg isolated some new strains of Hfr cells that they then used to map several genes in E. coli by using interrupted conjugation (A. L. Taylor and E. A. Adelberg. 1960. Genetics 45:1233–1243). In one experiment, they mixed cells of Hfr strain AB-312, which were xyl+ mtl+ mal+ met+ and sensitive to phage T6, with F− strain AB-531, which was xyl− mtl− mal− met− and resistant to phage T6. The cells were allowed to undergo conjugation. At regular intervals, the researchers removed a sample of cells and interrupted conjugation by killing the Hfr cells with phage T6. The F− cells, which were resistant to phage T6, survived and were then tested for the presence of genes transferred from the Hfr strain. The results of this experiment are shown in the accompanying graph. On the basis of these data, give the order of the xyl, mtl, mal, and met genes on the bacterial chromosome and indicate the minimum distances between them.
Question 9.22
A series of Hfr strains that have genotype m+ n+ o+ p+ q+ r+ are mixed with an F− strain that has genotype m− n− o− p− q− r−. Conjugation is interrupted at regular intervals and the order of the appearance of genes from the Hfr strain is determined in the recipient cells. The order of gene transfer for each Hfr strain is:
273
| Hfr5 | m+ q+ p+ n+ r+ o+ |
| Hfr4 | n+ r+ o+ m+ q+ p+ |
| Hfr1 | o+ m+ q+ p+ n+ r+ |
| Hfr9 | q+ m+ o+ r+ n+ p+ |
What is the order of genes on the circular bacterial chromosome? For each Hfr strain, give the location of the F factor in the chromosome and its polarity.
Question 9.23
Crosses of three different Hfr strains with separate samples of an F− strain are carried out, and the following mapping data are provided from studies of interrupted conjugation:
| Appearance of genes in F− cells | ||||||
|---|---|---|---|---|---|---|
| Hfr1: | Genes | b+ | d+ | c+ | f+ | g+ |
| Time | 3 | 5 | 16 | 27 | 59 | |
| Hfr2: | Genes | e+ | F+ | c+ | d+ | b+ |
| Time | 6 | 24 | 35 | 46 | 48 | |
| Hfr3: | Genes | d+ | c+ | f+ | e+ | g+ |
| Time | 4 | 15 | 26 | 44 | 58 | |
Construct a genetic map for these genes, indicating their order on the bacterial chromosome and the distances between them.
Question 9.24
In Figure 9.16, which gene on the F factor will be transferred last in strain Hfr5?
Question 9.25
DNA from a strain of Bacillus subtilis with the genotype trp+ tyr+ was used to transform a recipient strain with the genotype trp− tyr−. The following numbers of transformed cells were recovered:
| Genotype | Number of transformed cells | |
|---|---|---|
| trp+ tyr− | 154 | |
| trp− tyr+ | 312 | |
| trp+ tyr+ | 354 |
What do these results suggest about the linkage of the trp and tyr genes?
Question 9.26
DNA from a strain of Bacillus subtilis with genotype a+ b+ c+ d+ e+ is used to transform a strain with genotype a− b− c− d− e−. Pairs of genes are checked for cotransformation and the following results are obtained:
| Pair of genes | Cotransformation | Pair of genes | Cotransformation | |||
|---|---|---|---|---|---|---|
| a+ and b+ | no | b+ and d+ | no | |||
| a+ and c+ | no | b+ and e+ | yes | |||
| a+ and d+ | yes | c+ and d+ | no | |||
| a+ and e+ | yes | c+ and e+ | yes | |||
| b+ and c+ | yes | d+ and e+ | no |
On the basis of these results, what is the order of the genes on the bacterial chromosome?
Question 9.27
DNA from a bacterial strain that is his+ leu+ lac+ is used to transform a strain that is his− leu− lac−. The following percentages of cells were transformed:
| Donor strain | Recipient strain | Genotype of transformed cells | Percentage | |||
|---|---|---|---|---|---|---|
| his+ leu+ lac+ | his− leu− lac− | his+ leu+ lac+ | 0.02 | |||
| his+ leu+ lac− | 0.00 | |||||
| his+ leu− lac+ | 2.00 | |||||
| his+ leu− lac− | 4.00 | |||||
| his− leu+ lac+ | 0.10 | |||||
| his− leu− lac+ | 3.00 | |||||
| his− leu+ lac− | 1.50 |
- a. What conclusions can you make about the order of these three genes on the chromosome?
- b. Which two genes are closest?
Question 9.28
Rollin Hotchkiss and Julius Marmur studied transformation in the bacterium Streptococcus pneumoniae (R. D. Hotchkiss and J. Marmur. 1954. Proceedings of the National Academy of Sciences 40:55–60). They examined four mutations in this bacterium: penicillin resistance (P), streptomycin resistance (S), sulfanilamide resistance (F), and the ability to utilize mannitol (M). They extracted DNA from strains of bacteria with different combinations of different mutations and used this DNA to transform wild-type bacterial cells (P+ S+ F+ M+). The results from one of their transformation experiments are shown here.
| Donor DNA | Recipient DNA | Transformants | Percentage of all cells | ||||
|---|---|---|---|---|---|---|---|
| M S F | m+ S+ F+ | m+ S F+ | 4.0 | ||||
| M+ S+ F | 4.0 | ||||||
| M S+ F+ | 2.6 | ||||||
| M S F+ | 0.41 | ||||||
| M+ S F | 0.22 | ||||||
| M S+ F | 0.0058 | ||||||
| M S F | 0.0071 |
- a. Hotchkiss and Marmur noted that the percentage of cotransformation was higher than would be expected on a random basis. For example, the results show that the 2.6% of the cells were transformed into M and 4% were transformed into S. If the M and S traits were inherited independently, the expected probability of cotransformation of M and S (M S) would be 0.026 × 0.04 = 0.001, or 0.1%. However, they observed 0.41% M S cotransformants, four times more than they expected. What accounts for the relatively high frequency of cotransformation of the traits they observed?
- b. On the basis of the results, what conclusion can you make about the order of the M, S, and F genes on the bacterial chromosome?
- c. Why is the rate of cotransformation for all three genes (M S F) almost the same as the rate of cotransformation for M F alone?
Question 9.29
In the course of a study on the effects of the mechanical shearing of DNA, Eugene Nester, A. T. Ganesan, and Joshua Lederberg studied the transfer, by transformation, of sheared DNA from a wild-type strain of Bacillus subtilis (his2+ aro3+ try2+ aro1+ tyr1+ aro2+) to strains of bacteria carrying a series of mutations (E. W. Nester, A. T. Ganesan, and J. Lederberg. 1963. Proceedings of the National Academy of Sciences 49:61–68). They reported the following rates of cotransformation between his2+ and the other genes (expressed as cotransfer rate).
| Genes | Rate of cotransfer | |
|---|---|---|
| his2+ and aro3+ | 0.015 | |
| his2+ and try2+ | 0.10 | |
| his2+ and aro1+ | 0.12 | |
| his2+ and tyr1+ | 0.23 | |
| his2+ and aro2+ | 0.05 |
On the basis of these data, which gene is farthest from his2+? Which gene is closest?
Question 9.30
C. Anagnostopoulos and I. P. Crawford isolated and studied a series of mutations that affected several steps in the biochemical pathway leading to tryptophan in the bacterium Bacillus subtilis (C. Anagnostopoulos and I. P. Crawford. 1961. Proceedings of the National Academy of Sciences 47:378–390). Seven of the strains that they used in their study are listed here, along with the mutation found in that strain.
| Strain | Mutation | |
|---|---|---|
| T3 | T− | |
| 168 | I− | |
| 168PT | I− | |
| TI | I− | |
| TII | I− | |
| T8 | A− | |
| H25 | H− |
To map the genes for tryptophan synthesis, they carried out a series of transformation experiments on strains having different mutations and determined the percentage of recombinants among the transformed bacteria. Their results were as follows:
| Recipient | Donor | Percent recombinants | ||
|---|---|---|---|---|
| T3 | 168PT | 12.7 | ||
| T3 | T11 | 11.8 | ||
| T3 | T8 | 43.5 | ||
| T3 | H25 | 28.6 | ||
| 168 | H25 | 44.9 | ||
| TII | H25 | 41.4 | ||
| TI | H25 | 31.3 | ||
| T8 | H25 | 67.4 | ||
| H25 | T3 | 19.0 | ||
| H25 | TII | 26.3 | ||
| H25 | TI | 13.4 | ||
| H25 | T8 | 45.0 |
On the basis of these two-point recombination frequencies, determine the order of the genes and the distances between them. Where more than one cross was completed for a pair of genes, average the recombination rates from the different crosses. Draw a map of the genes on the chromosome.
Section 9.3
Question 9.31
Two mutations that affect plaque morphology in phages (a− and b−) have been isolated. Phages carrying both mutations (a− b−) are mixed with wild-type phages (a+ b+) and added to a culture of bacterial cells. Subsequent to infection and lysis, samples of the phage lysate are collected and cultured on bacterial cells. The following numbers of plaques are observed:
| Plaque phenotype | Number |
|---|---|
| a+ b+ | 2043 |
| a+ b− | 320 |
| a− b+ | 357 |
| a− b− | 2134 |
What is the frequency of recombination between the a and b genes?
Question 9.32
T. Miyake and M. Demerec examined proline-requiring mutations in the bacterium Salmonella typhimurium (T. Miyake and M. Demerec. 1960. Genetics 45:755762).
On the basis of complementation studies, they found four proline auxotrophs: proA, proB, proC, and proD. To determine whether proA, proB, proC, and proD loci were located close together on the bacterial chromosome, they conducted a transduction experiment. Bacterial strains that were proC+ and had mutations at proA, proB, or proD, were used as donors. The donors were infected with bacteriophages, and progeny phages were allowed to infect recipient bacteria with genotype proC− proA+ proB+ proD+. The bacteria were then plated on a selective medium that allowed only proC+ bacteria to grow. After this, the proC+ transductants were plated on selective media to reveal their genotypes at the other three pro loci. The following results were obtained:
275
| Donor genotype | Transductant genotype | Number |
|---|---|---|
| proC+ proA− proB+ proD+ | proC+ proA+ proB+ proD+ | 2765 |
| proC+ proA− proB+ proD+ | 3 | |
| proC+ proA+ proB− proD+ | proC+ proA+ proB+ proD+ | 1838 |
| proC+ proA+ proB− proD+ | 2 | |
| proC+ proA+ proB+ proD− | proC+ proA+ proB+ proD+ | 1166 |
| proC+ proA+ proB+ proD− | 0 |
- a. Why are there no proC− genotypes among the transductants?
- b. Which genotypes represent single transductants and which represent cotransductants?
- c. Is there evidence that proA, proB, and proD are located close to proC? Explain your answer.
Question 9.33
A geneticist isolates two mutations in a bacteriophage. One mutation causes clear plaques (c), and the other produces minute plaques (m). Previous mapping experiments have established that the genes responsible for these two mutations are 8 m.u. apart. The geneticist mixes phages with genotype c+ m+ and genotype c− m− and uses the mixture to infect bacterial cells. She collects the progeny phages and cultures a sample of them on plated bacteria. A total of 1000 plaques are observed. What numbers of the different types of plaques (c+ m+, c− m−, c+ m−, c− m+) should she expect to see?
Question 9.34
The geneticist carries out the same experiment described in Problem 33, but this time she mixes phages with genotypes c+ m− and c− m+. What results are expected from this cross?
Question 9.35
A geneticist isolates two bacteriophage r mutants (r13 and r2) that cause rapid lysis. He carries out the following crosses and counts the number of plaques listed here:
| Genotype of parental phage | Progeny | Number of plaques | |
|---|---|---|---|
| h+ r13− × h− r13+ | h+ r13+ | 1 | |
| h−r13+ | 104 | ||
| h+r13− | 110 | ||
| h−r13− | 2 | ||
| Total | 216 | ||
| h+r2− × h−r2+ | h+ r2+ | 6 | |
| h−r2+ | 86 | ||
| h+ r2− | 81 | ||
| h−r2− | 7 | ||
| Total | 180 |
- a. Calculate the recombination frequencies between r2 and h and between r13 and h.
- b. Draw all possible linkage maps for these three genes.
Question 9.36
E. coli cells are simultaneously infected with two strains of phage λ. One strain has a mutant host range, is temperature sensitive, and produces clear plaques (genotype is h st c); another strain carries the wild-type alleles (genotype is h+ st+ c+). Progeny phages are collected from the lysed cells and are plated on bacteria. The numbers of different progeny phages are given here:
| Progeny phage genotype | Number of plaques |
|---|---|
| h+ c+ st+ | 321 |
| h c st | 338 |
| h+ c st | 26 |
| h c+ st+ | 30 |
| h+c st+ | 106 |
| h c+ st | 110 |
| h+ c+ st | 5 |
| h c st+ | 6 |
- a. Determine the order of the three genes on the phage chromosome.
- b. Determine the map distances between the genes.
- c. Determine the coefficient of coincidence and the interference.
Question 9.37
A donor strain of bacteria with genes a+ b+ c+ is infected with phages to map the donor chromosome with generalized transduction. The phage lysate from the bacterial cells is collected and used to infect a second strain of bacteria that are a− b− c−. Bacteria with the a+ gene are selected, and the percentage of cells with cotransduced b+ and c+ genes are recorded.
| Donor | Recipient | Selected gene | Cells with cotransduced gene (%) |
|---|---|---|---|
| a+ b+ c+ | a− b− c− | a+ | 25 b+ |
| a+ | 3 c+ |
Is gene b or gene c closer to gene a? Explain your reasoning.
Question 9.38
A donor strain of bacteria with genotype leu+ gal− pro+ is infected with phages. The phage lysate from the bacterial cells is collected and used to infect a second strain of bacteria that are leu− gal+ pro−. The second strain is selected for leu+, and the following cotransduction data are obtained:
276
| Donor | Recipient | Selected gene | Cells with cotransduced gene (%) |
|---|---|---|---|
| leu+ gal− pro+ | leu− gal+ pro− | leu+ | 47 pro+ |
| leu+ | 26gal− |
Which genes are closest, leu and gal or leu and pro?
Question 9.39
A geneticist isolates two new mutations, called rIIx and rIIy, from the rII region of bacteriophage T4. E. coli B cells are simultaneously infected with phages carrying the rIIx mutation and with phages carrying the rIIy mutation. After the cells have lysed, samples of the phage lysate are collected. One sample is grown on E. coli K cells; a second sample is grown on E. coli B cells. There are 8322 plaques on E. coli B and 3 plaques on E. coli K. What is the recombination frequency between these two mutations?
Question 9.40
A geneticist is working with a new bacteriophage called phage Y3 that infects E. coli. He has isolated eight mutant phages that fail to produce plaques when grown on E. coli strain K. To determine whether these mutations occur at the same functional gene, he simultaneously infects E. coli K cells with paired combinations of the mutants and looks to see whether plaques are formed. He obtains the following results. (A plus sign means that plaques were formed on E. coli K; a minus sign means that no plaques were formed on E. coli K.)
| Mutant | 1 | 2 | 3 | 4 | 5 | 6 | 7 | 8 |
|---|---|---|---|---|---|---|---|---|
| 1 | ||||||||
| 2 | + | |||||||
| 3 | + | + | ||||||
| 4 | + | − | + | |||||
| 5 | − | + | + | + | ||||
| 6 | − | + | + | + | − | |||
| 7 | + | − | + | − | + | + | ||
| 8 | − | + | + | + | − | − | + |
- a. To how many functional genes (cistrons) do these mutations belong?
- b. Which mutations belong to the same functional gene?
Question 9.41
For the H1N1 influenza virus shown at the bottom of Figure 9.33, viruses from which organism contributed the most RNA to the H1N1 virus?