Kernel Color in Wheat
To illustrate how multiple genes acting on a characteristic can produce a continuous range of phenotypes, let us examine one of the first demonstrations of polygenic inheritance. Nilsson-Ehle studied kernel color in wheat and found that the intensity of red pigmentation was determined by three unlinked loci, each of which had two alleles.
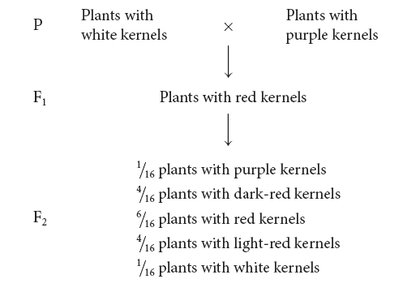
NILSSON-EHLE’S CROSS Nilsson-Ehle obtained several homozygous varieties of wheat that differed in color. Like Mendel, he performed crosses between these homozygous varieties and studied the ratios of phenotypes in the progeny. In one experiment, he crossed a variety of wheat that possessed white kernels with a variety that possessed purple kernels and obtained the following results:
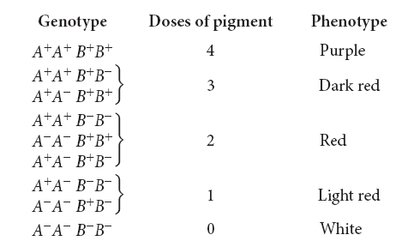
INTERPRETATION OF THE CROSS Nilsson-Ehle interpreted this phenotypic ratio as the result of the segregation of alleles at two loci (although he found alleles at three loci that affect kernel color, the two varieties used in this cross differed at only two of the loci). He proposed that there were two alleles at each locus: one that produced red pigment and another that produced no pigment. We’ll designate the alleles that encoded pigment A+ and B+ and the alleles that encoded no pigment A− and B−. Nilsson-Ehle recognized that the effects of the genes were additive. Each gene seemed to contribute equally to color; so the overall phenotype could be determined by adding the effects of all the alleles, as shown in the following table:
Notice that the purple and white phenotypes are each encoded by a single genotype, but the other phenotypes may result from several different genotypes.
From these results, we see that five phenotypes are possible when alleles at two loci influence the phenotype and the effects of the genes are additive. If alleles at more than two loci influenced the phenotype, more phenotypes would be possible, and the color would appear to vary continuously between white and purple. If environmental factors had influenced the characteristic, individuals of the same genotype would vary somewhat in color, making it even more difficult to distinguish between discrete phenotypic classes. Luckily, environment played little role in determining kernel color in Nilsson-Ehle’s crosses, and only a few loci encoded color, so Nilsson-Ehle was able to distinguish among the different phenotypic classes. This ability allowed him to see the Mendelian nature of the characteristic.
Let’s now see how Mendel’s principles explain the ratio obtained by Nilsson-Ehle in his F2 progeny. Remember that Nilsson-Ehle crossed the homozygous purple variety (A+A+ B+B+) with the homozygous white variety (A−A− B−B−), producing F1 progeny that were heterozygous at both loci (A+A− B+B−). This is a dihybrid cross, like those that we worked in Chapter 3, except that both loci encode the same trait. Each of the F1 plants possessed two pigment-producing alleles, so each plant received two doses of pigment, which produced red kernels. The types and proportions of progeny expected in the F2 can be found by applying Mendel’s principles of segregation and independent assortment.
Let’s first examine the effects of each locus separately. At the first locus, two heterozygous F1s are crossed (A+A− × A+A−). As we learned in Chapter 3, when two heterozygotes are crossed, we expect progeny in the proportions ¼ A+A+, ½ A+A−, and ¼ A−A−. At the second locus, two heterozygotes also are crossed, and again, we expect progeny in the proportions ¼ B+B+, ½ B+B−, and ¼ B−B−.
To obtain the probability of combinations of genes at both loci, we must use the multiplication rule (see Chapter 3), the use of which assumes Mendel’s principle of independent assortment. The expected proportion of F2 progeny with genotype A+A+ B+B+ is the product of the probability of obtaining genotype A+A+ (¼) and the probability of obtaining genotype B+B+ (¼), or ¼ × ¼ = 1/16 (Figure 17.4). The probabilities of each of the phenotypes can then be obtained by adding the probabilities of all the genotypes that produce that phenotype. For example, the red phenotype is produced by three genotypes:
| Genotype |
Phenotype |
Probability |
| A+A+ B−B− |
Red |
¼ × ¼ = 1/16 |
| A−A− B+B+ |
Red |
¼ × ¼ = 1/16 |
| A+A− B+B− |
Red |
½ × ½ = ¼ |
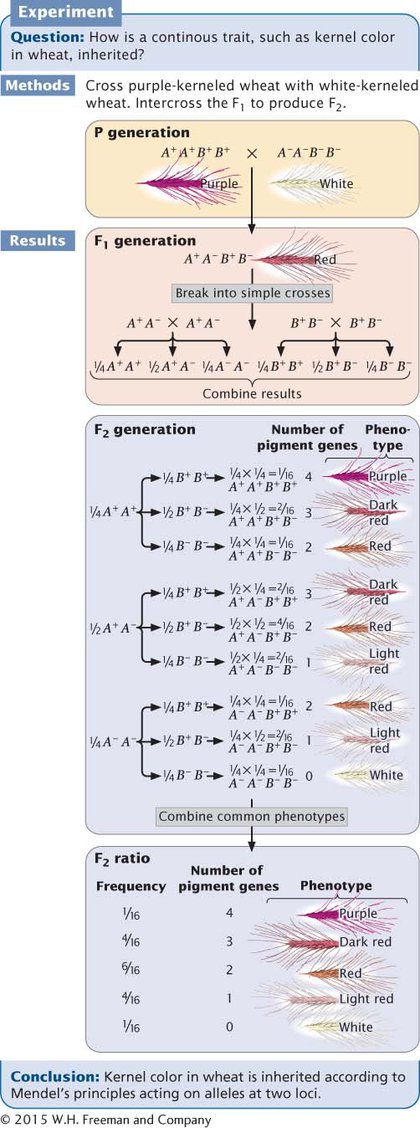
Figure 17.4: Nilsson-Ehle demonstrated that kernel color in wheat is inherited according to Mendelian principles. The ratio of phenotypes in the F2 can be determined by breaking the dihybrid cross into two simple single-locus crosses and combining the results by using the multiplication rule.
Thus, the overall probability of obtaining red kernels in the F2 progeny is 1/16 + 1/16 + 1/4 = 6/16. Figure 17.4 shows that the phenotypic ratio expected in the F2 is 1/16 purple, 4/16 dark red, 6/16 red, 4/16 light red, and 1/16 white. This phenotypic ratio is precisely what Nilsson-Ehle observed in his F2 progeny, demonstrating that the inheritance of a continuously varying characteristic such as kernel color does indeed occur according to Mendel’s basic principles.
CONCLUSIONS AND IMPLICATIONS Nilsson-Ehle’s crosses demonstrated that the difference between the inheritance of genes influencing quantitative characteristics and the inheritance of genes influencing discontinuous characteristics is in the number of loci that determine the characteristic. When multiple loci affect a characteristic, more genotypes are possible, so the relation between the genotype and the phenotype is less obvious. For example, in a cross of F1 individuals heterozygous for alleles at a single locus with additive effects, 3 phenotypes appear among the progeny (Figure 17.5). When the parents of the cross are heterozygous at two loci, there are 5 phenotypes in the progeny, and when the parents are heterozygous at five loci, there are 11 phenotypes in the progeny. As the number of loci affecting a characteristic increases, the number of phenotypic classes in the F2 increases.  TRY PROBLEM 12
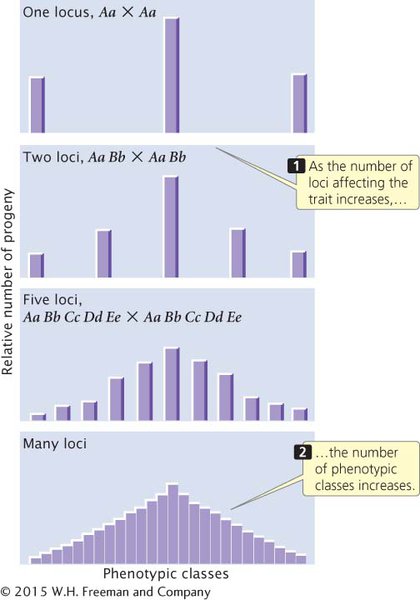
Figure 17.5: The results of crossing individuals heterozygous for different numbers of loci affecting a characteristic.
CONCEPTS
The same principles determine the inheritance of quantitative and discontinuous characteristics, but more genes take part in the determination of quantitative characteristics.