The Mean
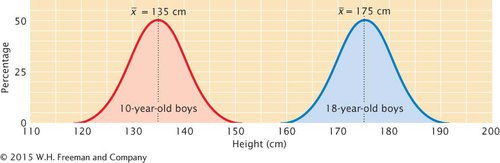
The mean, also called the average, is a statistic that provides information about the center of a distribution. If we measured the heights of 10-
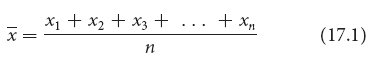
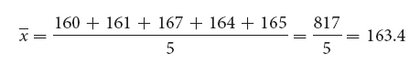
Suppose that we have five measurements of height in centimeters: 160, 161, 167, 164, and 165. If we represent a group of measurements as x1, x2, x3, and so forth, then the mean (x̄) is calculated by adding all the individual measurements and dividing by the total number of measurements in the sample (n):
In our example, x1 = 160, x2 = 161, x3 = 167, and so forth. The mean height x̄ equals
A shorthand way to represent this formula is
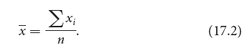
or
where the symbol Σ means “the summation of” and xi represents the individual x values.