Rates of Molecular Evolution
Findings from molecular studies of numerous genes have demonstrated that different genes, and even different parts of the same gene, may evolve at different rates. Rates of evolutionary change in nucleotide sequences are usually measured as the rate of nucleotide substitution, which is the number of substitutions taking place per nucleotide site per year.
NONSYNONYMOUS AND SYNONYMOUS RATES OF SUBSTITUTION Nucleotide changes in a gene that alter the amino acid sequence of a protein are referred to as nonsynonymous substitutions. Nucleotide changes, particularly those at the third position of a codon, that do not alter the amino acid sequence are called synonymous substitutions. The rate of nonsynonymous substitution varies widely among mammalian genes. The rate for the a-
| Gene | Nonsynonymous rate (per site per 109 years) | Synonymous rate (per site per 109 years) |
|---|---|---|
| α-Actin | 0.01 | 3.68 |
| β-Actin | 0.03 | 3.13 |
| Albumin | 0.91 | 6.63 |
| Aldolase A | 0.07 | 3.59 |
| Apoprotein E | 0.98 | 4.04 |
| Creatine kinase | 0.15 | 3.08 |
| Erythropoietin | 0.72 | 4.34 |
| α-Globin | 0.55 | 5.14 |
| β-Globin | 0.80 | 3.05 |
| Growth hormone | 1.23 | 4.95 |
| Histone 3 | 0.00 | 6.38 |
| Immunoglobulin heavy chain (variable region) | 1.07 | 5.66 |
| Insulin | 0.13 | 4.02 |
| Interferon α 1 | 1.41 | 3.53 |
| Interferon γ | 2.79 | 8.59 |
| Luteinizing hormone | 1.02 | 3.29 |
| Somatostatin- |
0.00 | 3.97 |
|
Source: After W. Li and D. Graur, Fundamentals of Molecular Evolution (Sunderland, Mass.: Sinauer Associates, 1991), p. 69. |
||
491
SUBSTITUTION RATES FOR DIFFERENT PARTS OF A GENE Different parts of a gene also evolve at different rates. The highest rates of substitution occur in those regions of the gene that have the least effect on function, such as the third position of a codon, flanking regions, and introns (Figure 18.17). The 5′ and 3′ flanking regions of genes are not transcribed into RNA; therefore, substitutions in these regions do not alter the amino acid sequence of the protein, although they may affect gene expression (see Chapter 12). Rates of substitution in introns are nearly as high. Although these nucleotides do not encode amino acids, introns must be spliced out of the pre-
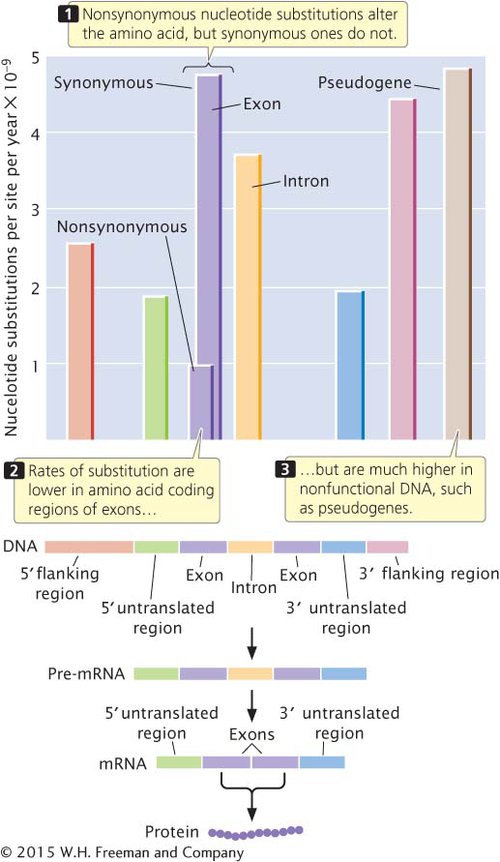
Substitution rates are somewhat lower in the 5′ and 3′ untranslated regions of a gene. As we know from Chapters 10 and 11, these regions are transcribed into RNA but do not encode amino acids. The 5′ untranslated region contains the ribosome-
The lowest rates of substitution are seen for nonsynonymous changes in the coding region because these substitutions always alter the amino acid sequence of the protein and are often deleterious. High rates of substitution take place in pseudogenes, most of which are duplicate copies of genes that have been rendered nonfunctional by mutations. Such genes no longer produce a functional product, so mutations in pseudogenes have little effect on the fitness of the organism.
In summary, there is a relation between the function of a sequence and its rate of evolution. The highest rates of change are found where the changes have the least effect on function.