The Dihybrid Testcross
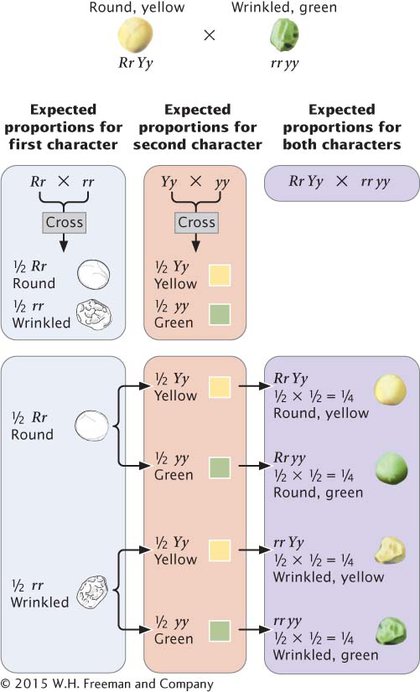
Let’s practice using the branch diagram by predicting the types and proportions of phenotypes in a dihybrid testcross between the round and yellow F1 pea plants (Rr Yy) obtained by Mendel in his dihybrid cross and wrinkled and green pea plants (rr yy), as depicted in Figure 3.11. First, break the cross down into a series of single-
59
WORKED PROBLEM
The principles of segregation and independent assortment are important not only because they explain how heredity works, but also because they provide the means for predicting the outcome of genetic crosses. This predictive power has made genetics a powerful tool in agriculture and other fields, and the ability to apply the principles of heredity is an important skill for all students of genetics. Practice with genetics problems is essential for mastering the basic principles of heredity; no amount of reading and memorization can substitute for the experience gained by deriving solutions to specific problems in genetics.
You may find genetics problems difficult if you are unsure of where to begin or how to organize a solution to the problem. In genetics, every problem is different, and so no common series of steps can be applied to all genetics problems. Logic and common sense must be used to analyze a problem and arrive at a solution. Nevertheless, certain steps can facilitate the process, and solving the following problem will serve to illustrate those steps.
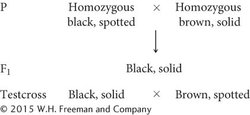
In mice, black coat color (B) is dominant over brown (b), and a solid pattern (S) is dominant over a white-
Give the genotypes of the parents and the F1 mice.
Give the genotypes and phenotypes, along with their expected ratios, of the progeny expected from the testcross.
Solution Strategy
What information is required in your answer to the problem?
First, determine what question or questions the problem is asking. Is it asking for genotypes, or genotypic ratios, or phenotypic ratios? This problem asks you to provide the genotypes of the parents and the F1, the expected genotypes and phenotypes of the progeny of the testcross, and their expected proportions.
What information is provided to solve the problem?
Next, determine what information is provided that will be necessary for solving the problem. This problem gives important information about the dominance relations of the traits and the genes that encode them:
Black is dominant over brown.
Solid is dominant over white-
spotted. The genes for the two characteristics assort independently.
Symbols for the different alleles: B for black, b for brown, S for solid, and s for spotted.
It is often helpful to write down the symbols at the beginning of the solution:
B—black S—solid
b—brown s—white-
Next, write out the crosses, as given in the problem:
For help with this problem, review:
Sections 3.2 and 3.3.
Solution Steps
STEP 1: Write down any genetic information that can be determined from the phenotypes alone.
60
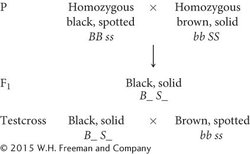
From the phenotypes and the statement that they are homozygous, you know that the P-
STEP 2: Break the problem down into smaller parts.
First, determine the genotype of the F1. After this genotype has been determined, you can predict the results of the testcross and determine the genotypes and phenotypes of the progeny of the testcross. Second, because this cross includes two independently assorting loci, it can be conveniently broken down into two single-
STEP 3: Work the different parts of the problem.
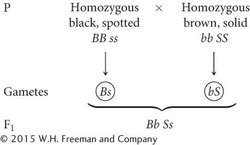
Start by determining the genotype of the F1 progeny. Mendel’s first law indicates that the two alleles at a locus separate, one going into each gamete. Thus, the gametes produced by the black, spotted parent contain B s and the gametes produced by the brown, solid parent contain b S, which combine to produce F1 progeny with the genotype Bb Ss:
Use the F1 genotype to work the testcross (Bb Ss × bb ss), breaking it into two single-
Bb × bb
↓
½ Bb black
½ bb brown
Next, consider the cross for spotting: Ss × ss. This cross is between a heterozygote and a homozygous recessive genotype and produces ½ solid (Ss) and ½ spotted (ss) progeny (see Table 3.2):
Ss × ss
↓
½ Ss solid
½ ss spotted
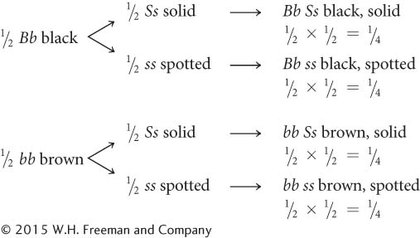
Finally, determine the proportions of progeny with combinations of these characteristics by using the branch diagram.
STEP 4: Check all work.
As a last step, reread the problem, checking to see if your answers are consistent with the information provided. You have used the genotypes BB ss and bb SS in the P generation. Do these genotypes encode the phenotypes given in the problem? Are the F1 progeny phenotypes consistent with the genotypes that you assigned? The answers are consistent with the information.
 Now that we have stepped through a genetics problem together, try your hand at Problem 29 at the end of the chapter.