Gene Interaction with Epistasis
Sometimes the effect of gene interaction is that one gene masks (hides) the effect of another gene at a different locus, a phenomenon known as epistasis. In the examples of genic interaction that we have already examined, genes at different loci interacted to determine a single phenotype, but one gene did not mask the effect of a gene at another locus, and there was no epistasis. Epistasis is similar to dominance, except that dominance entails the masking of genes at the same locus (allelic genes). In epistasis, the gene that does the masking is called an epistatic gene; the gene whose effect is masked is a hypostatic gene. Epistatic genes may be recessive or dominant in their effects.
RECESSIVE EPISTASIS Recessive epistasis is seen in the genes that determine coat color in Labrador retrievers. These dogs may be black, brown (frequently called chocolate), or yellow; their different coat colors are determined by interactions between genes at two loci (although a number of other loci also help to determine coat color). One locus determines the type of pigment produced by the skin cells: a dominant allele B encodes black pigment, whereas a recessive allele b encodes brown pigment. Alleles at a second locus affect the deposition of the pigment in the shaft of the hair: allele E allows dark pigment (black or brown) to be deposited, whereas a recessive allele e prevents the deposition of dark pigment, causing the hair to be yellow. The presence of genotype ee at the second locus therefore masks the expression of the black and brown alleles at the first locus. The genotypes that determine coat color and their phenotypes are
95
| Genotype | Phenotype |
|---|---|
| B_ E_ | black |
| bb E_ | brown |
| B_ ee | yellow |
| bb ee | yellow |
If we cross a black Labrador that is homozygous for the dominant alleles (BB EE) with a yellow Labrador that is homozygous for the recessive alleles (bb ee) and then intercross the F1, we obtain progeny in the F2 in a 9 : 3 : 4 ratio:
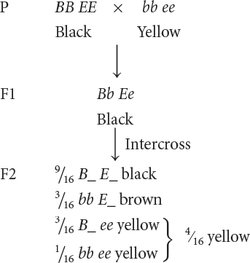
Notice that yellow dogs can carry alleles for either black or brown pigment, but these alleles are not expressed in their coat color. In this example of gene interaction, allele e is epistatic to B and b because e masks the expression of the alleles for black and brown pigments, and alleles B and b are hypostatic to e. In this case, e is a recessive epistatic allele because two copies of e must be present to mask the expression of the black and brown pigments.
Another example of an epistatic gene is the gene that determines the Bombay phenotype; this gene masks the expression of alleles at the ABO locus. In most people, a dominant allele (H) encodes an enzyme that makes H, a molecule necessary for the production of ABO antigens. People with the Bombay phenotype are homozygous for a recessive mutation (h) that encodes a defective enzyme. That defective enzyme is incapable of making H, and because H is not produced, no ABO antigens are synthesized. People with the genotype hh who would normally have A, B, or AB blood types do not produce antigens and therefore express an O phenotype. In this example, the alleles at the ABO locus are hypostatic to the recessive h allele.
DOMINANT EPISTASIS In recessive epistasis, the presence of two recessive alleles (the homozygous genotype) inhibits the expression of an allele at a different locus. In dominant epistasis, only a single copy of an allele is required to inhibit the expression of an allele at a different locus.
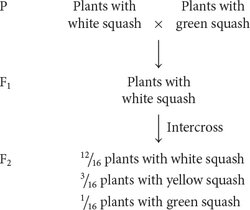
Dominant epistasis is seen in the interaction of two loci that determine fruit color in summer squash, which is commonly found in one of three colors: yellow, white, or green. When a homozygous plant that produces white squash is crossed with a homozygous plant that produces green squash and the F1 plants are crossed with each other, the following results are obtained:
How can gene interaction explain these results?
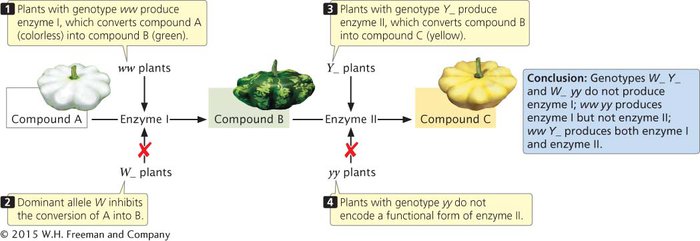
In the F2, 12/16, or ¾, of the plants produce white squash and 3/16 + 1/16 = 4/16 = 1/4 of the plants produce colored squash. This outcome is the familiar 3 : 1 ratio produced by a cross between two heterozygotes, which suggests that a dominant allele at one locus inhibits the production of pigment, resulting in white progeny. If we use the symbol W to represent the dominant allele that inhibits pigment production, the genotype W_ inhibits pigment production and produces white squash, whereas ww allows pigment production and results in colored squash.
Among those ww F2 plants with pigmented fruit, we observe 3/16 yellow and 1/16 green (a 3 : 1 ratio). This observation suggests that a second locus determines the type of pigment produced in the squash, with yellow (Y_) dominant over green (yy). This locus is expressed only in ww plants, which lack the dominant inhibitory allele W. We can assign the genotype ww Y_ to plants that produce yellow squash and the genotype ww yy to plants that produce green squash. The genotypes and their associated phenotypes are
| W_ Y_ | white squash |
| W_ yy | white squash |
| ww Y_ | yellow squash |
| ww yy | green squash |
Allele W is epistatic to Y and y: it suppresses the expression of these pigment-
97
Yellow pigment in the squash is most likely produced in a two-
CONCEPTS
Epistasis is the masking of the expression of one gene by another gene at a different locus. The epistatic gene does the masking; the hypostatic gene is masked. Epistatic alleles can be dominant or recessive.
 CONCEPT CHECK 8
A number of all-
Aa
Aa Bb
A_ B_
A_ bb
d
CONNECTING CONCEPTS
Interpreting Phenotypic Ratios Produced by Gene Interaction
A number of modified phenotypic ratios that result from gene interaction are shown in Table 4.5. Each of these examples represents a modification of the basic 9 : 3 : 3 : 1 dihybrid ratio. In interpreting the genetic basis of such modified ratios, we should keep several points in mind. First, the inheritance of the genes producing these characteristics is no different from the inheritance of genes encoding simple genetic characters. Mendel’s principles of segregation and independent assortment still apply; each individual possesses two alleles at each locus, which separate in meiosis, and genes at the different loci assort independently. The only difference is in how the products of the genotypes interact to produce the phenotype. Thus, we cannot consider the expression of genes at each locus separately; instead, we must take into consideration how the genes at different loci interact.
A second point is that, in the examples that we have considered, the phenotypic proportions were always in sixteenths, because in all the crosses, pairs of alleles segregated at two independently assorting loci. The probability of inheriting one of the two alleles at a locus is ½. Because there are two loci, each with two alleles, the probability of inheriting any particular combination of genes is (½)4 = 1/16. For a trihybrid cross, the progeny proportions should be in sixty-
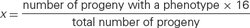
Crosses rarely produce exactly 16 progeny; therefore, modifications of the dihybrid ratio are not always obvious. Modified dihybrid ratios are more easily seen if the number of individuals of each phenotype is expressed in sixteenths:
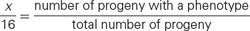
where x/16 equals the proportion of progeny with a particular phenotype. If we solve for x (the proportion of the particular phenotype in sixteenths), we have
For example, suppose that we cross two homozygotes, interbreed the F1, and obtain 63 red, 21 brown, and 28 white F2 individuals. Using the preceding formula, we find the phenotypic ratio in the F2 to be red = (63 × 16)/112 = 9; brown = (21 × 16)/112 = 3; and white = (28 × 16)/112 = 4. The phenotypic ratio is 9 : 3 : 4.
A final point to consider is how best to assign genotypes to the phenotypes in modified ratios that result from gene interaction. Don’t try to memorize the genotypes associated with all the modified ratios in Table 4.5. Instead, practice relating modified ratios to known ratios, such as the 9: 3 : 3 : 1 dihybrid ratio. Suppose that we obtain 15/16 green progeny and 1/16 white progeny in a cross between two plants. If we compare this 15 : 1 ratio with the standard 9 : 3 : 3 : 1 dihybrid ratio, we see that 9/16 + 3/16 + 3/16 equals 15/16. All the genotypes associated with these proportions in the dihybrid cross (A_ B_, A_ bb, and aa B_) must give the same phenotype, the green progeny. Genotype aa bb makes up 1/16 of the progeny in a dihybrid cross, the white progeny in this cross.
97
In assigning genotypes to phenotypes in modified ratios, students sometimes become confused about which letters to assign to which phenotype. Suppose that we obtain the following phenotypic ratio: 9/16 black : 3/16 brown : 4/16 white. Which genotype do we assign to the brown progeny, A_ bb or aa B_? Either answer is correct because the letters are just arbitrary symbols for the genetic information. The important thing to realize about this ratio is that the brown phenotype arises when two recessive alleles are present at one locus.
| Ratio* | Genotype | Type of interaction | Example discussed in text | |||
|---|---|---|---|---|---|---|
| A_ B_ | A_ bb | aa B_ | aa bb | |||
| 9 : 3 : 3 : 1 | 9 | 3 | 3 | 1 | None | Seed shape and seed color in peas |
| 9 : 3 : 4 | 9 | 3 | 4 | Recessive epistasis | Coat color in Labrador retrievers | |
| 12 : 3 : 1 | 12 | 3 | 1 | Dominant epistasis | Color in squash | |
| 9 : 7 | 9 | 7 | Duplicate recessive epistasis | — | ||
| 9 : 6 : 1 | 9 | 6 | 1 | Duplicate interaction | — | |
| 15 : 1 | 15 | 1 | Duplicate dominant epistasis | — | ||
| 13 : 3 | 13 | 3 | Dominant and recessive epistasis | — | ||
*Each ratio is produced by a dihybrid cross (Aa Bb × Aa Bb). Shaded bars represent combinations of genotypes that give the same phenotype.
WORKED PROBLEM
A homozygous strain of yellow corn is crossed with a homozygous strain of purple corn. The F1 are intercrossed, producing an ear of corn with 119 purple kernels and 89 yellow kernels (the progeny). What is the genotype of the yellow kernels?
Solution Strategy
What information is required in your answer to the problem?
The genotype of the yellow kernels.
What information is provided to solve the problem?
A homozygous yellow corn plant is crossed with a homozygous purple corn plant.
The numbers of purple and yellow progeny produced by the cross.
Solution Steps
We should first consider whether the cross between yellow and purple strains might be a monohybrid cross for a simple dominant trait, which would produce a 3 : 1 ratio in the F2 (Aa × Aa → ¾ A_ and ¼ aa). Under this hypothesis, we would expect 156 purple progeny and 52 yellow progeny:
| Phenotype | Genotype | Observed number | Expected number |
|---|---|---|---|
| purple | A_ | 119 | ¾ × 208 = 156 |
| yellow | aa | 89 | ¼ × 208 = 52 |
| Total | 208 |
We see that the expected numbers do not closely fit the observed numbers. If we performed a chi-
Another possible hypothesis is that the observed F2 progeny are in a 1 : 1 ratio. However, we learned in Chapter 3 that a 1 : 1 ratio is produced by a cross between a heterozygote and a homozygote (Aa × aa), and in this cross, both original parental strains were homozygous. Furthermore, a chi-
Next, we should look to see if the results can be explained by a dihybrid cross (Aa Bb × Aa Bb). A dihybrid cross results in phenotypic proportions that are in sixteenths. We can apply the formula given earlier in the chapter to determine the number of sixteenths for each phenotype:
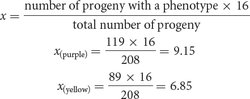
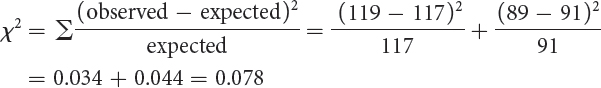
Thus, purple and yellow appear in an approximate ratio of 9 : 7. We can test this hypothesis with a chi-
| Phenotype | Genotype | Observed number | Expected number |
|---|---|---|---|
| purple | ? | 119 | 9/16 × 208 = 117 |
| yellow | ? | 89 | 7/16 × 208 = 91 |
| Total | 208 |
98
Degree of freedom = n − 1 = 2 − 1 = 1
P > 0.05
The probability associated with the chi-
We now need to determine how a dihybrid cross can produce a 9 : 7 ratio and what genotypes correspond to the two phenotypes. A dihybrid cross without epistasis produces a 9 : 3 : 3 : 1 ratio:
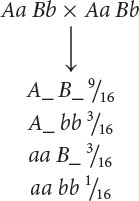
Because 9/16 of the progeny from the corn cross are purple, purple must be produced by genotypes A_ B_; in other words, individual kernels that have at least one dominant allele at the first locus and at least one dominant allele at the second locus are purple. The proportions of all the other genotypes (A_ bb, aa B_, and aa bb) sum to 7/16, which is the proportion of the progeny in the corn cross that are yellow, and so any individual kernel that does not have a dominant allele at both the first and the second locus is yellow.
 Now test your understanding of epistasis by working Problem 34 at the end of this chapter.